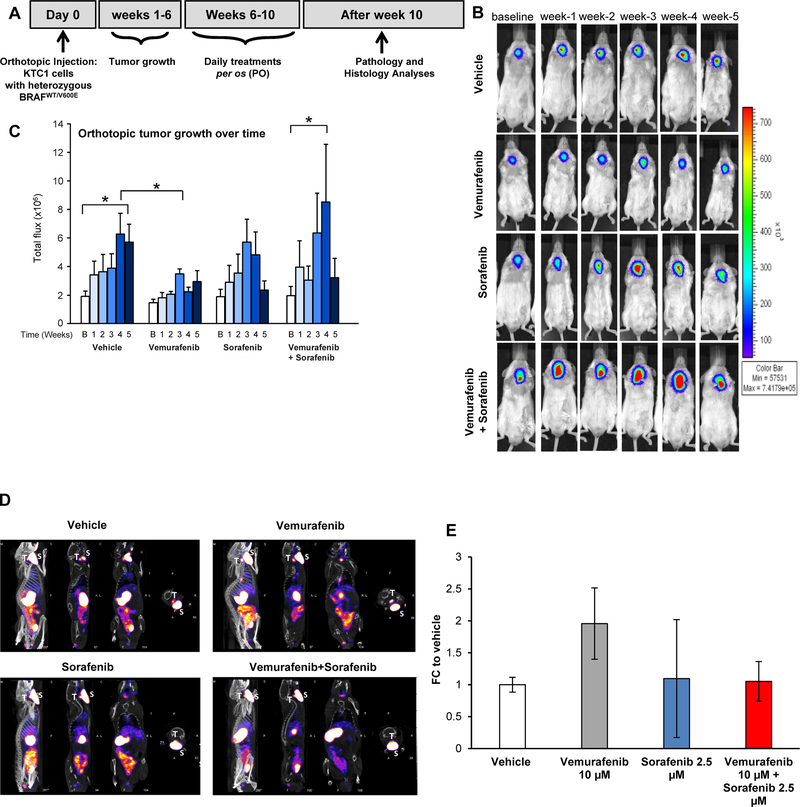
Figure 2. Effects of targeted therapy with vemurafenib and sorafenib in a late intervention model of an orthotopic mouse using PTC-derived KTC1 cells harboring the heterozygous BRAFV600E mutation.
A) Experimental design of an in vivo late intervention orthotopic preclinical model using BRAFWT/V600E-KTC1 cells derived from a patient with invasive PTC harboring the heterozygous BRAFWT/V600E mutation. Human BRAFWT/V600E-KTC1 cells, engineered to express luciferase, were implanted in 20 nine-week-old male NSG mice, which were then treated with vemurafenib, sorafenib, combined therapy, or vehicle (n=5 for each experimental condition). Their orthotopic tumors were evaluated by histology and bioluminiscence imaging. Either vehicle, vemurafenib (100 mg/kg, one time daily), sorafenib (30 mg/kg, one time daily), or combined therapy vemurafenib (100 mg/kg, one time daily) plus sorafenib (30 mg/kg, one time daily) treatments were begun at 6 weeks post-tumor implantation, and the response to drugs was evaluated weekly for 5 weeks. (B) BLI (bioluminescence imaging, emission of photons/second) analysis for tumor growth assessment (by luciferase signal) in mice treated daily with vehicle, vemurafenib, sorafenib, or combined therapy for five weeks. (C) Total flux analysis of BLI (emission of photons/second) and distribution of data showed that five weeks of vemurafenib treatment resulted in significantly lower orthotopic tumor growth than in controls (vehicle treatment) (*p<0.05, Mann-Whitney test). Sorafenib therapy was fluctuant and resulted in a smaller reduction in tumor growth. Combined therapy showed a rising trend in tumor growth at week 4 followed by a decrease at week 5 vs. vehicle treatment. B=baseline. (D) MicroSPECT/CT representative images of results plotted in E. T= mouse thyroids, S= mouse salivary glands. (E) Quantification of technetium-99 (99mTc) uptake in BRAFWT/V600E-positive KTC1 orthotopic tumors based on the standardized uptake value (SUV) calculated by tissue radioactivity concentration/injected activity/body weight in grams and obtained by combining CT (Computed Tomography) and microSPECT (Single Photon Emission Computed Tomography) imaging analysis performed in mice at four weeks post-treatment with vehicle (n=2), vemurafenib (100 mg/kg, one time daily) (n=2), sorafenib (30 mg/kg, one time daily) (n=2), or combined therapy with vemurafenib (100 mg/kg, one time daily) plus sorafenib (30 mg/kg, one time daily) (n=2). These data represent the fold change (FC) ± standard deviation (error bars) compared to the vehicle treatment.

