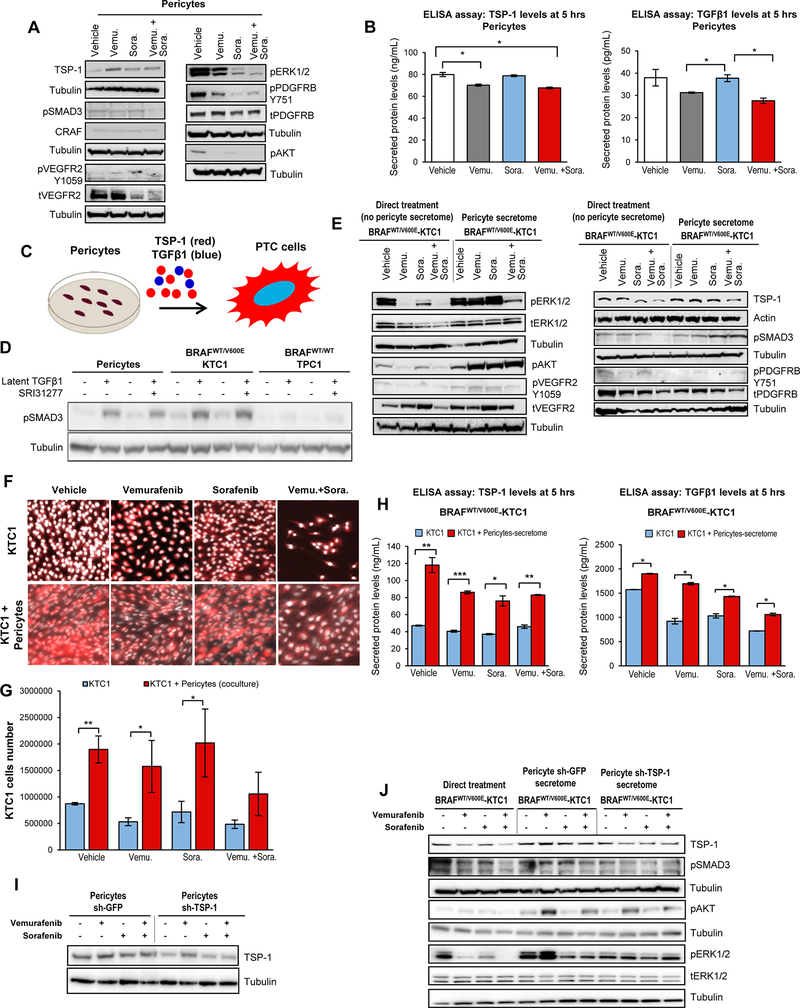
Figure 3. Model of co-culture with PTC patient-derived cells harboring the heterozygous BRAFV600E mutation and pericytes reveals resistance to BRAFV600E and tyrosine kinase inhibitors via the TSP-1/TGFβ1 axis.
A) Western blot analysis of proteins expression levels in pericytes at 5 hrs treatment with DMSO (vehicle), 10 μM vemurafenib, 2.5 μM sorafenib and combined therapy with 10 μM vemurafenib plus 2.5 μM sorafenib. These results were validated by three independent replicate measurements. Cells were grown in 0.2% FBS DMEM growth medium during treatment. B) Measurements of secreted TSP-1 and TGFβ1 total protein levels in pericytes treated for 5 hrs with DMSO (vehicle), 10 μM vemurafenib, 2.5 μM sorafenib, or combined therapy with 10 μM vemurafenib plus 2.5 μM sorafenib, in the presence of 0.2% FBS DMEM growth medium. The secretome (0.2% FBS DMEM cell growth medium enriched by cell-derived secreted protein factors) was collected and protein levels (ng/mL or pg/mL) were determined by ELISA (enzyme-linked immunosorbent assay). Secreted protein levels were normalized to cell growth medium (DMEM supplemented with 0.2% FBS) which was measured to determine subtracted background. These data represent the average ± standard deviation (error bars) of two independent replicate measurements (*p<0.05). C) Diagram of secreted factors (i.e. TSP-1, TGFβ1) derived from human pericytes treated for 5 hrs with vehicle, 10 μM vemurafenib, 2.5 μM sorafenib, or combined therapy with 10 μM vemurafenib plus 2.5 μM sorafenib grown in the presence of 0.2% FBS DMEM growth medium as shown in A; secreted factors represent pericyte conditioned medium to treat PTC cells. D) Western blot analysis of pSMAD3 proteins expression levels in human pericytes, BRAFWT/V600E-KTC1 and BRAFWT/WT-TPC1 cells treated for 5 hrs with vehicle, recombinant human latent TGFβ1 protein (2 ng/mL), 10 μM SRI31277, or recombinant human latent TGFβ1 protein (2 ng/mL) plus 10 μM SRI31277 in the presence of 0.2% FBS DMEM growth medium. E) Western blot analysis of proteins expression levels in BRAFWT/V600E-KTC1 cells at 5 hrs direct treatment (without pericytes conditioned medium; cells were grown in 0.2% FBS DMEM growth medium during treatment) with DMSO (vehicle), 10 μM vemurafenib, 2.5 μM sorafenib, or combined therapy with 10 μM vemurafenib plus 2.5 μM sorafenib; or 5 hrs treatments with pericyte-derived conditioned medium (defined secretome) treated with DMSO (vehicle), 10 μM vemurafenib, 2.5 μM sorafenib or combined therapy with 10 μM vemurafenib plus 2.5 μM sorafenib as shown in A. These results were validated by three independent replicates. F) Fluorescence imaging for fixed BRAFWT/V600E-KTC1mCherry cells alone (highlighted by mCherry and Hoechst staining, with red and white signal, respectively) or co-cultured with pericytes (highlighted by mCherry (red signal) specific to label KTC1 cells and Hoechst (white signal) staining to label both KTC1 cells and pericytes). KTC1 cells or co-cultures were treated for 48 hrs with DMSO (vehicle), 10 μM vemurafenib, 2.5 μM sorafenib, or combined therapy with 10 μM vemurafenib plus 2.5 μM sorafenib. Cells were grown in 0.2% FBS DMEM growth medium during treatment. G) Quantification of only BRAFWT/V600E-KTC1mCherry cells reported in F. These data represent the average ± standard deviation (error bars) of three independent replicates (*p<0.05, **p<0.01). H) Measurements of secreted TSP-1 and TGFβ1 total protein levels in: BRAFWT/V600E-KTC1 cells directly treated (without pericyte conditioned medium, blue bars) for 5 hrs with DMSO (vehicle), 10 μM vemurafenib, 2.5 μM sorafenib, or combined therapy with 10 μM vemurafenib plus 2.5 μM sorafenib in the presence of 0.2% FBS DMEM growth medium; and in BRAFWT/V600E-KTC1 cells treated for 5 hrs with pericyte-derived conditioned medium (secretome, red bars) treated with DMSO (vehicle), 10 μM vemurafenib, 2.5 μM sorafenib, or combined therapy with 10 μM vemurafenib plus 2.5 μM sorafenib, in the presence of 0.2% FBS DMEM growth medium. The secretome (pericyte-derived conditioned medium) was collected and protein levels (ng/mL or pg/mL) were determined by ELISA (enzyme-linked immunosorbent assay). Secreted protein levels were normalized to cell growth medium (DMEM supplemented with 0.2% FBS) that was measured to determine subtracted background. These data represent the average ± standard deviation (error bars) of two independent replicates (*p<0.05, **p<0.01, ***p<0.001). I) Western blot analysis of protein expression levels in sh-GFP (control) or sh-TSP-1 pericytes at 5 hrs treatment with DMSO (vehicle), 10 μM vemurafenib, 2.5 μM sorafenib and combined therapy with 10 μM vemurafenib plus 2.5 μM sorafenib in the presence of 0.2% FBS DMEM growth medium. These results were validated by two independent replicates. J) Western blot analysis of protein expression levels in BRAFWT/V600E-KTC1 cells at 5 hrs direct treatment (without pericyte-derived conditioned medium) with DMSO (vehicle), 10 μM vemurafenib, 2.5 μM sorafenib, or combined therapy with 10 μM vemurafenib plus 2.5 μM sorafenib in the presence of 0.2% FBS DMEM growth medium; or 5 hrs treatments with sh-GFP (control) or sh-TSP-1 pericyte-derived conditioned medium (secretome) treated with DMSO (vehicle), 10 μM vemurafenib, 2.5 μM sorafenib, or combined therapy with 10 μM vemurafenib plus 2.5 μM sorafenib as shown in I. These results were validated by 2 independent replicates.

