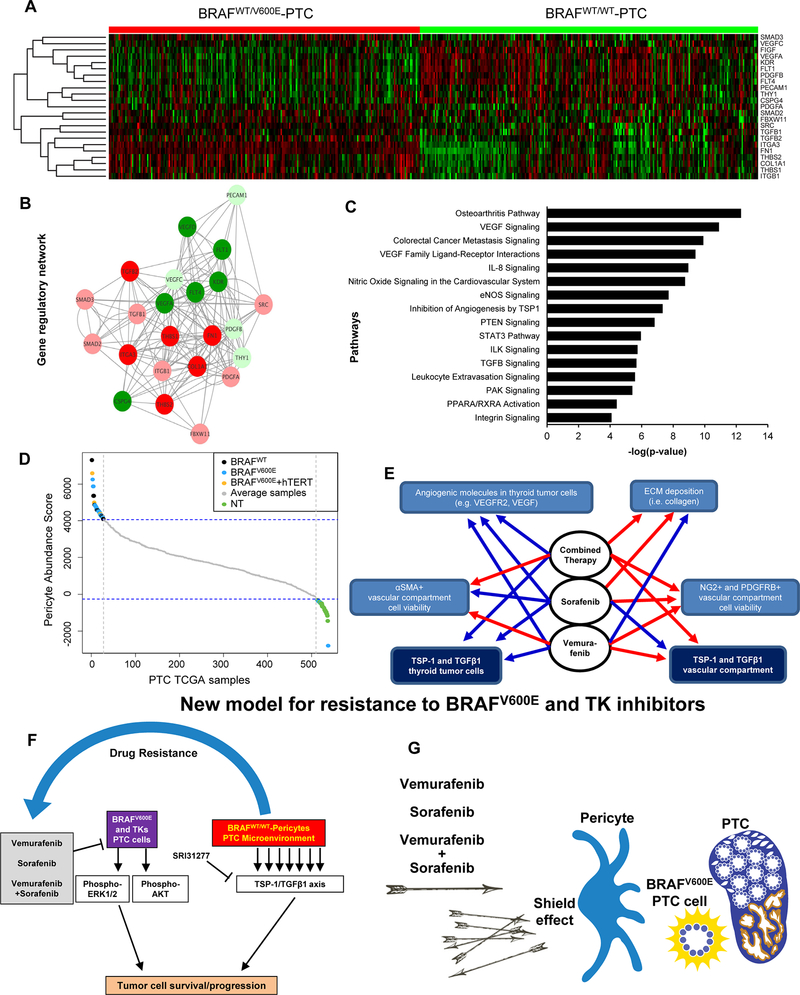
Figure 6. TSP-1 (THBS1) gene regulatory networks and pericytes abundance in BRAFWT/V600E-PTC versus BRAFWT/WT-PTC clinical samples.
(A) In the heatmap, rows depict differentially expressed genes and columns depict BRAFWT/V600E-PTC vs. BRAFWT/WT-PTC (PTC TCGA data base) samples. The relative expression level of genes is shown using a color scale. Colors indicate standardized values (green represents gene down-regulation and red represents gene up-regulation). (B) THBS1 (TSP-1) regulatory networks with genes differentially expressed in BRAFV600E-PTC vs. BRAFWT-PTC human samples (PTC TCGA data base) built up by Cytoscape. Each node represents a gene and each edge represents the interaction between the genes. We observed that there is a significant interaction between the differentially expressed genes that are identified from BRAFWT/V600E-PTC vs. BRAFWT/WT-PTC human samples analysis. The co-expression analysis for these genes was performed on the basis of PTC TCGA data (interactions with p-value <0.05 from correlation test were considered significant). Image shows genes that depict significant interaction with TSP-1 or TGFβ1. Circles indicate genes deregulated in BRAFWT/WT-PTC vs BRAFWT/V600E-PTC samples; the color intensity corresponds to the extent of upregulation/downregulation based on the log2FC values. (C) Pathways enrichment analysis for significantly differentially expressed genes shown in (A) in BRAFWT/V600E-PTC vs. BRAFWT/WT-PTC. The significance of effect/enrichment on pathways is shown along x-axis as –log10 p-value. For pathways analysis: -Log10 p-value 1.3= p-value= 0.05; -log10 p-value 2= p-value= 0.01; -log10 p-value 3= p-value= 0.001; -log10 p-value 4= p-value=0.0001. (D) Plot of the pericytes abundance calculated by the pericytes abundance score in normal thyroid (NT) samples, BRAFWT/V600E-PTC, PTC harboring both BRAFV600E and hTERT mutations, and BRAFWT/WT-PTC samples (PTC TCGA data base) arranged in the order of their scores from highest to lowest. Only the 5% most pericytes enriched samples and the 5% least pericytes enriched samples are highlighted in color with the rest of the average samples shown in grey. The color code is green for NT samples, blue for BRAFWT/V600E-PTC; black for BRAFWT/WT-PTC, and orange for PTC with BRAFWT/V600E and hTERT mutations. (E) Flow chart that summarizes effects of vemurafenib, sorafenib, or combined therapy on the angiogenic molecules expression, collagen deposition, and TSP-1/TGFβ1/SMAD3 expression in the BRAFWT/V600E-KTC1 orthotopic tumor cells and vessels compartment (see Fig.5). Blue line=down-regulation/inhibitory effects. ECM=extracellular matrix. Red line=no inhibitory effects. (F-G) Overview of treatment with vemurafenib, sorafenib, or combined therapy. Combined therapy determines cell death in thyroid tumor cells; role of pericytes which might trigger resistance to these agents via the TSP1/TGFβ1 axis.

