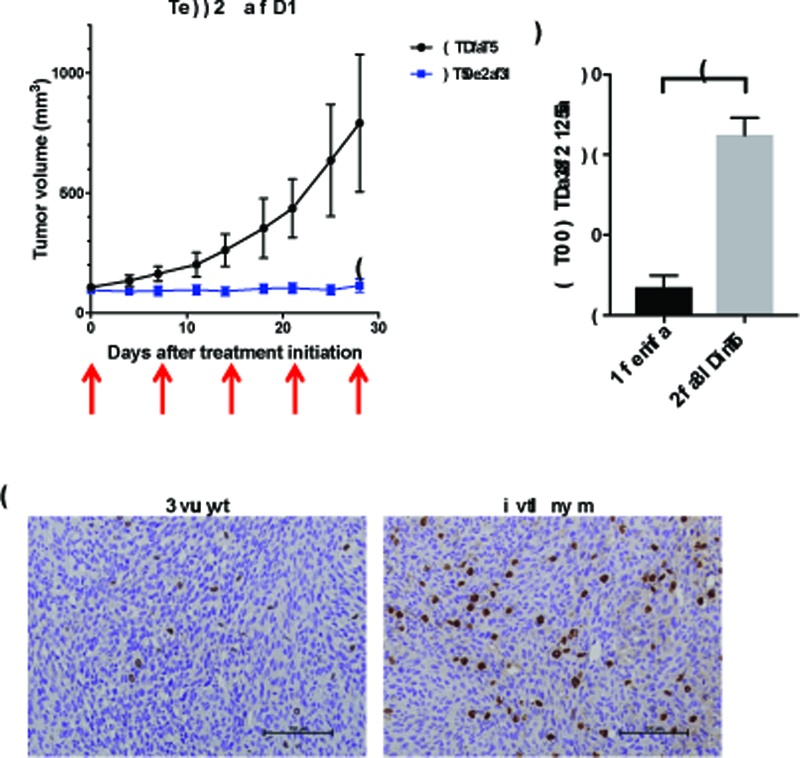
Figure 3. PLK1 inhibitor suppresses MMR-deficient, TMZ-resistant glioma tumor growth in vivo.

(A) Tumor growth curves in LN229shMSH6 xenograft model. Animals were treated with Volasertib (40 mg/kg i.v. once a week x 5 cycles)(N=5) or PBS (Control, N=6). Data are presented as mean tumor volume and SD in each group. Arrows indicate dates of treatment. *, P=0.017, PBS vs Volasertib on day 27 (Mann-Whitney test). (B, C) Nude mice bearing established flank LN229shMSH6 tumors were treated i.v. with a single dose of 40mg/kg Volasertib (N=3) or PBS (Control, N=3). Flank tumors were collected at 24 hours after dosing, and pHH3 immunohistochemistry was performed (brown) (B). Scale bars, 100 μm. (C) Quantification of B is shown. *, P=0.006, PBS (Control) vs Volasertib (student t-test).
