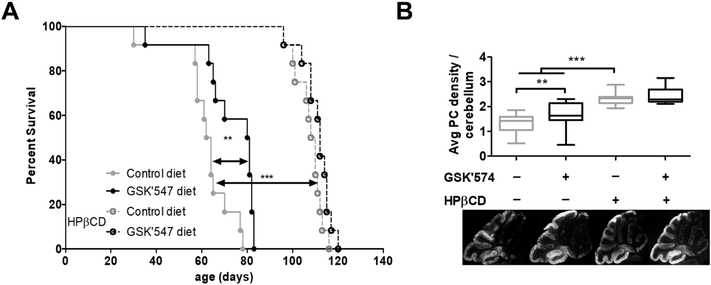
Figure 2. Pharmacological inhibition of RIPK1 with GS’C547.
A) Kaplan-Mayer survival curve for Npc1−/− treated with a control diet or mouse chow containing 833 mg·kg−1 of GSK’547. A second cohort of Npc1 mutant mice on either control or GSK’547 chow was treated with 4000 mg·kg−1 of HPβCD. Each experimental group consisted of 12 mice. Comparisons were made using the Log-Rank Mantel-Cox test **P<0.01 and *** P<0.001. B) Box and whisker plot of average cerebellar Purkinje neuron density per 100 μM. Representative photomicrographs of sagittal sectioned cerebellar tissue stained with anti-calbindin 28K are shown below the graph. Data were obtained from three sagittal sections obtained from six animals corresponding to each genotype. *p<0.05 and ***p<0.001 Mann-Whitney test.

