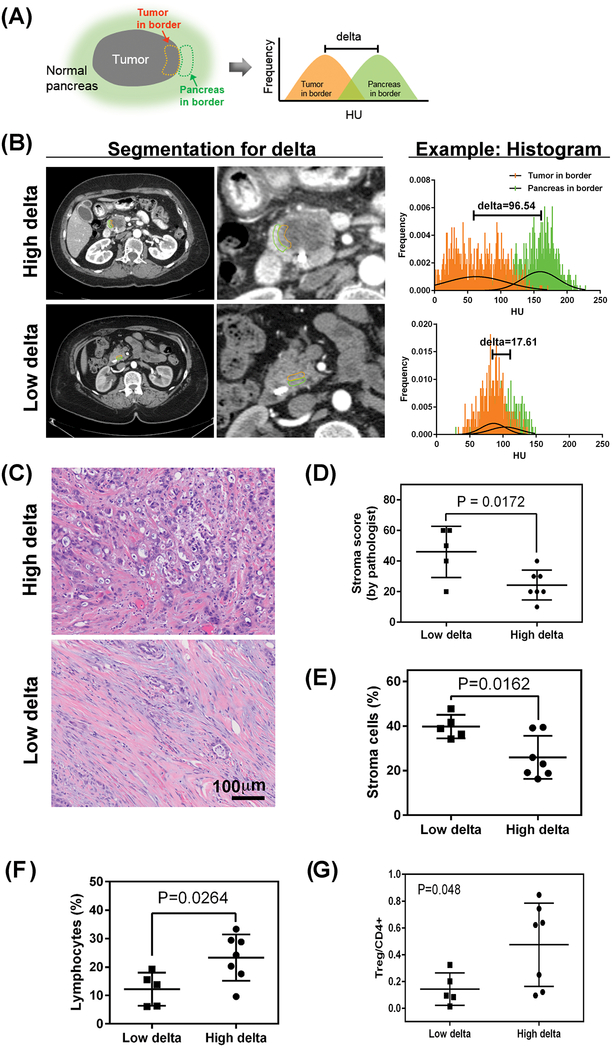
Fig 1.
Quantification of the interface between the pancreatic tumor and surrounding normal pancreas. (A) The “delta” method to characterize the interface of pancreatic ductal adenocarcinoma (PDAC) involves contouring the tumor at the border and the normal pancreas at the border. The Hounsfield unit (HU) distribution within each contour can be compared, providing a difference in mean HU. (B) Representative CT scans with contouring of the tumor at the border (orange) and the normal pancreas at the border (green) and the corresponding HU histogram. (C) Representative images and corresponding histology of low- and high-delta tumors. H&E, hematoxylin and eosin. (D) Association of stroma and delta measurement in 12 patients on a trial of intraoperative gemcitabine infusion (Supplementary Table S1, also see Supplementary Fig. S5 for validation cohort). (E) The proportions of cellular subtypes from pathology specimens from 12 patients on a trial of intraoperative gemcitabine infusion (Supplementary Table S1) are shown for stroma cells (E) and lymphocytes (F). For validation, the same algorithm was applied to 17 more patients who underwent upfront resection (i.e., no neoadjuvant therapy) (see Supplementary Fig. S7, S8). (G) Association of high and low delta classification with T regulatory cell markers, normalized by CD4 positive cells.

