Fig 3.
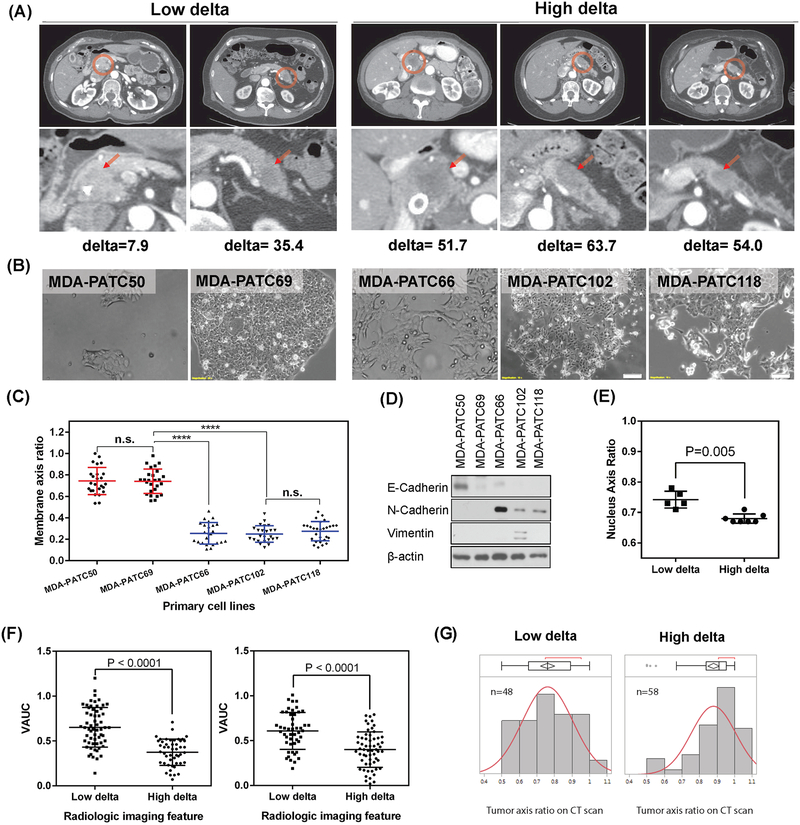
Distinct morphologic properties of cancer cells in low and high delta tumors. (A) CT scans of 5 patients who underwent upfront surgery. (B) Cancer cell lines from the 5 patients in (A) (MDA-PATC50, −69, −66, −102, and −118). (C) The membrane axis ratio, stratified by the delta measurement (Wilcoxon test; n.s., not significant, ****P<0.0001). A high membrane axis ratio indicates a rounder shape. (D) Western blots of the 5 cell lines for markers of the epithelial-to-mesenchymal transition. (E) Nuclear morphology, measured from segmentation on histology. Left panel, nucleus axis ratio was measured from H&E-stained slides of 12 patients in a prospective protocol of intraoperative gemcitabine infusion during PDAC resection (Supplementary Table S1); (F) Physical properties of PDAC stratified by delta measurement, as measured by Volumetric AUC (VAUC) for patients in Supplementary Table S2 (left) and Supplementary Table S3 (right), and (G) by tumor axis ratio from CT scans with orthogonal measurements on a single axial slice at greatest tumor size for patients in Supplementary Table S3 (Wilcoxon test, P<0.0001).

