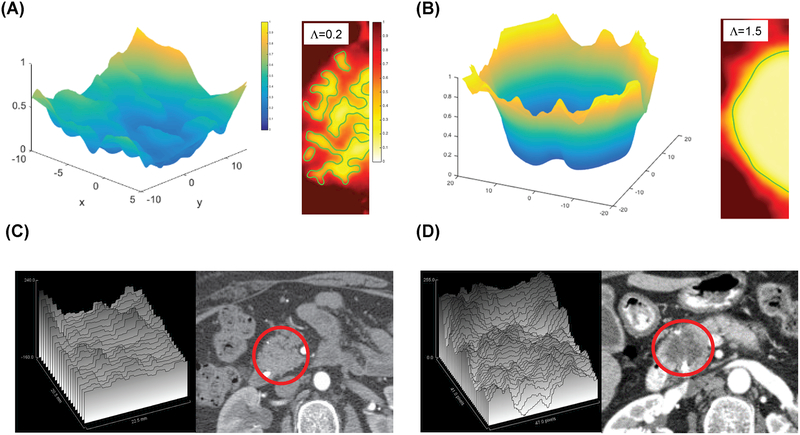
Fig 5.
Computer simulations of tumor interface morphology during growth. (A, left panel) and (B, left panel) represent perfusion fields predicted by the simulations, rescaled with the perfusion value in the stroma away from the tumor. The predicted change in perfusion from surrounding parenchyma to tumor is more homogeneous in tumors with relatively low cancer cell proliferation rate (Λ=0.2) (A), whereas the perfusion gradient is steeper and deeper for tumors where the cancer cell proliferation rate is high (Λ =1.5) (B). (A, right panel) and (B, right panel) represent morphology of tumors from the same two simulations. The morphology of the simulated tumors with low stability parameter Λ shows intermingling of tumor and stroma (characterized by low-mode instabilities manifesting as large “fingers” of cell clusters (A, right inset). In contrast, for high Λ ((B, right inset), the simulation reveals a distinct interface between tumor and stroma. Representative surface profiles (HU) generated by ImageJ of the CT images are shown in the left panels of C and D with the corresponding CT images on the right. The tumor in the CT images is circled in red.

