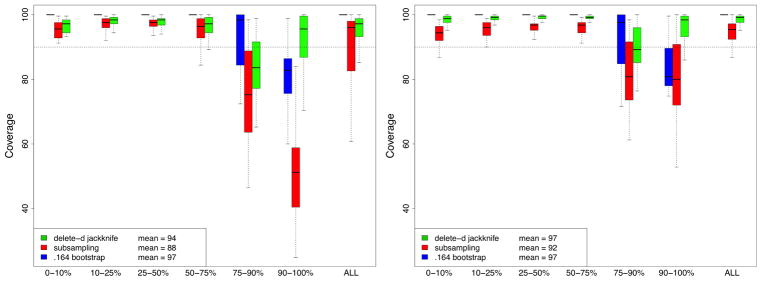
FIGURE 4.
Coverage of VIMP 90% asymptotic normal confidence intervals from RF-R simulations. Left and right hand side figures based on subsampling rates b = n1/2 and b = n3/4 respectively. Confidence regions for the 240 variables from the 12 simulation experiments have been stratified into 6 groups based on 10, 25, 50, 75, and 90th percentiles of true finite VIMP values.

