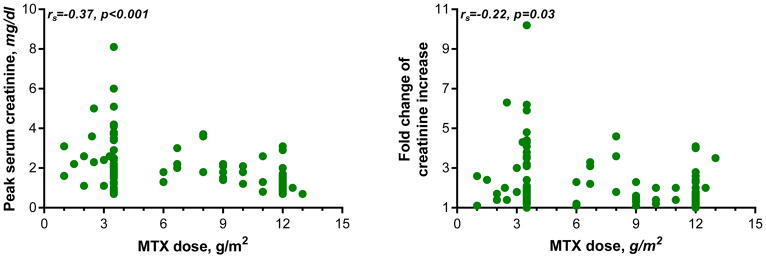
Figure 1. Serum creatinine change from baseline after MTX administration.
Figure depicts the serum creatinine change from baseline after 100 courses of HDMTX administration in 88 patients. The left panel is the serum creatinine levels in mg/dL and the right panel is the fold change increase in serum creatinine after HDMTX administration. The red line is the median value and the colored band is the interquartile interval.
HDMTX=high-dose methotrexate; IQR=interquartile range; MTX=methotrexate

