
Fig. 1.
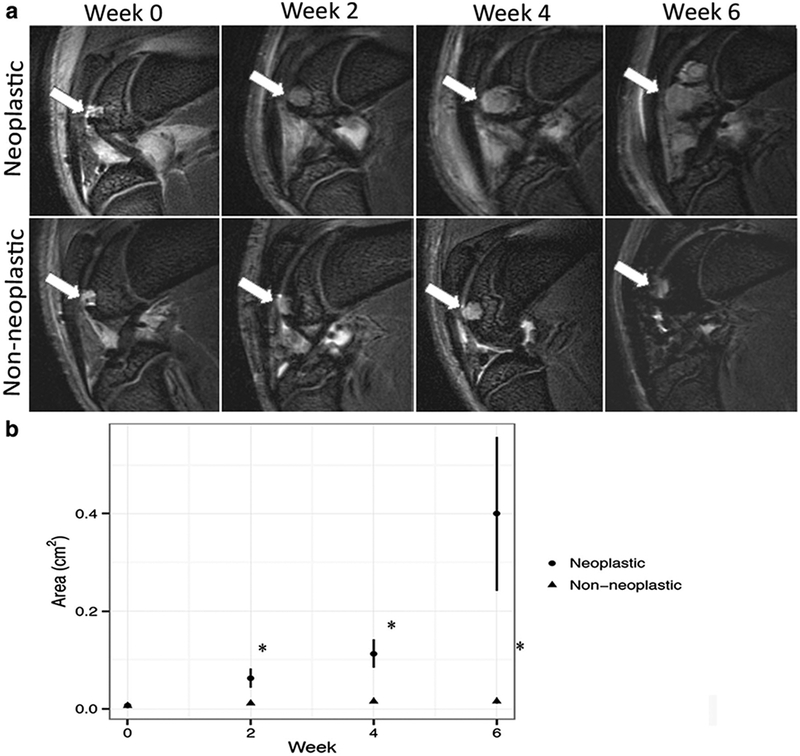
Magnetic resonance findings for neoplastic and non-neoplastic transplants. a Sagittal T2-weighted FSE images (TR/TE = 3000 ms/30 ms) of ADSC transplants in cartilage defects of distal femurs (arrows): neoplastic ADSC implants show significant increase in size over 6 weeks, whereas non-neoplastic ADSC implants did not expand. b Corresponding size of neoplastic and non-neoplastic ADSC transplants at different time points after implantation, displayed as mean transplant area with standard errors. A single asterisk indicates significant differences between neoplastic and non-neoplastic ADSC transplants (p < 0.05).