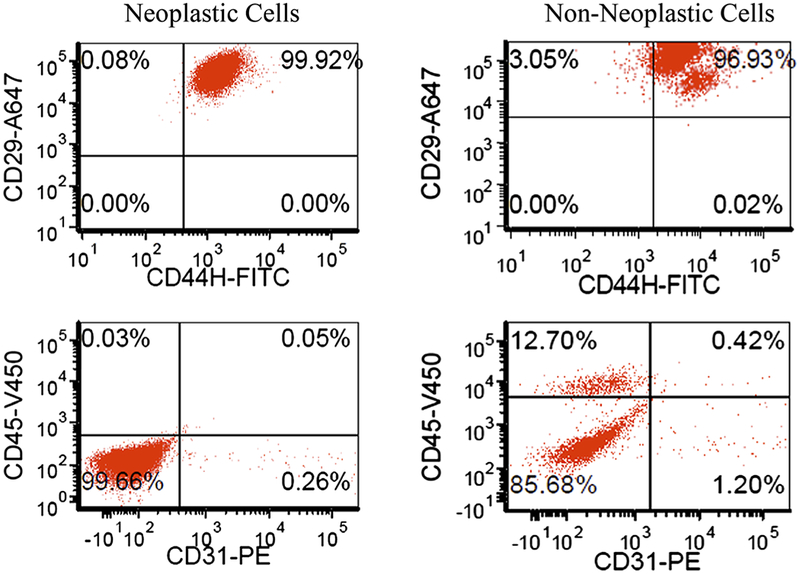
Fig. 4.

Neoplastic and non-neoplastic cells’ CD marker expression. Dual axis dot plots show similar expression for neoplastic and non-neoplastic transplants: CD29 and CD44H positive and CD31 negative. Phenotypic markers are not sufficient to discriminate the presence of neoplastic cells in a future transplant.
