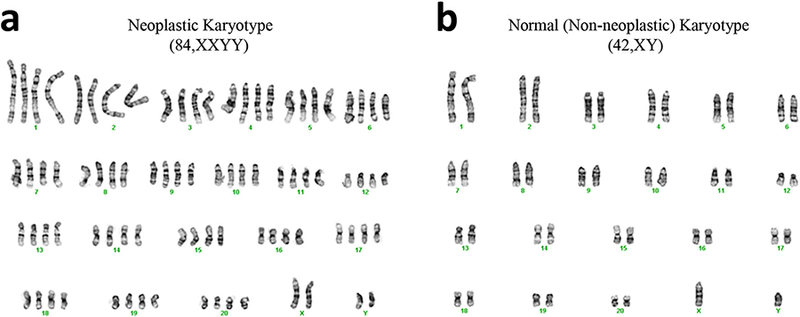
Fig. 5.

Chromosome analysis of a neoplastic and b non-neoplastic ADSC. Neoplastic cells show a mixed population of normal male diploid (42, XY) and aberrant tetraploid (84, XXYY) cells without obvious structural rearrangement or genetic imbalance while non-neoplastic ADSC show a normal karyotype.
