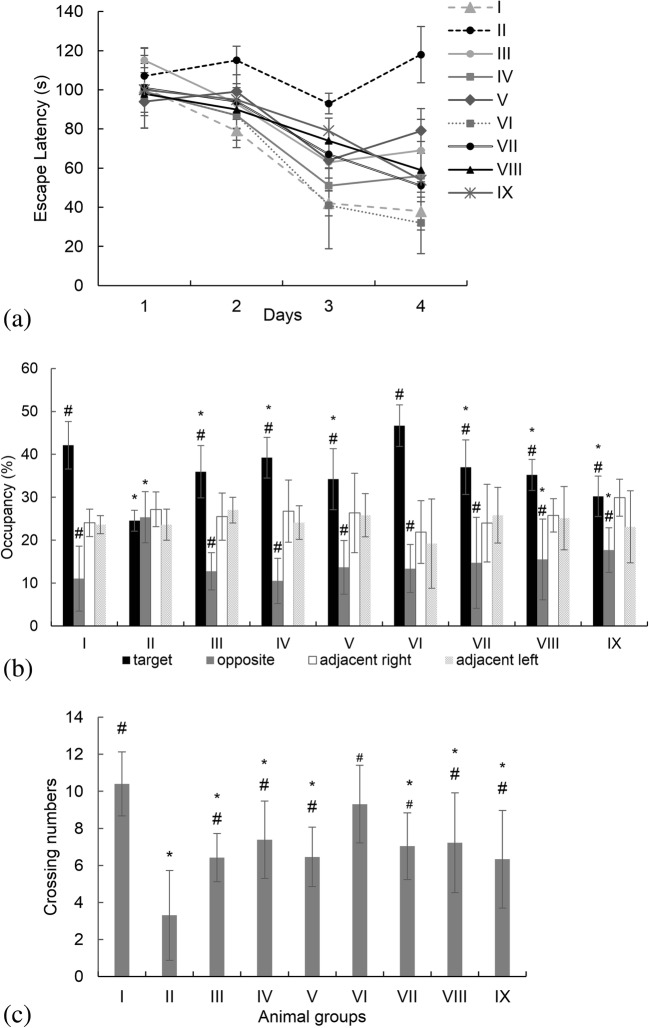
Fig. 5.
Morris water maze study. (a) The animals’ escape latency, (b) Percentage of time spent in the target, opposite, adjacent right and adjacent left quadrants during probe trial, and (c) The number of the platform site crossings during the probe trial. Group classification is described in Table 1. *p value <0.05 comparing to the group I (sham group). #p value <0.05 comparing to the group II (negative control group)

