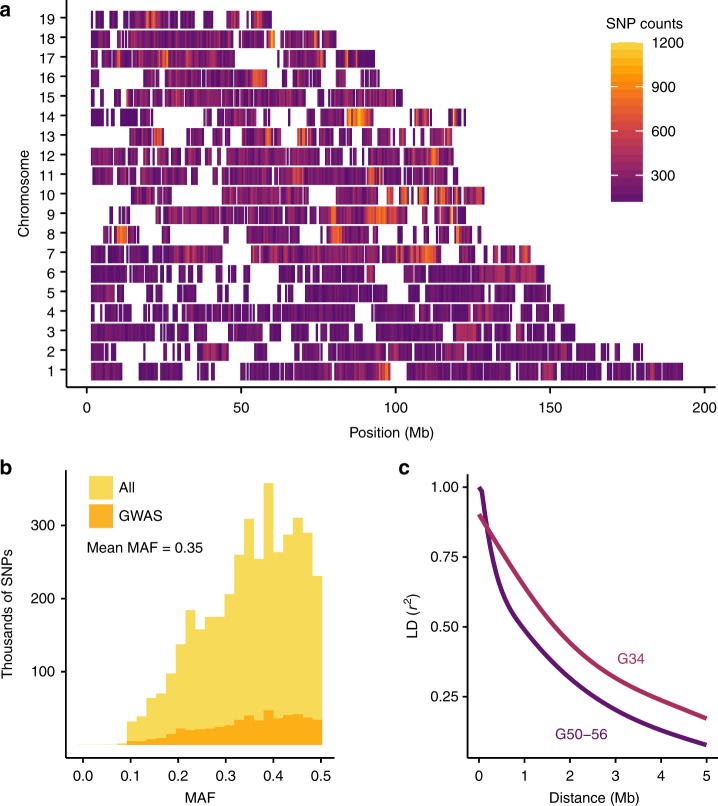
Fig. 1.
Variants, MAFs and LD decay in the LG × SM AIL. Imputation provided 4.3 million SNPs. Filtering for LD (r2 ≥ 0.95), MAF < 0.1, and HWE (p ≤ 7.62 × 10⁻⁶, Chi-squared test) resulted in 523,028 SNPs for GWAS. a SNP distribution and density of GWAS SNPs are plotted in 500 kb windows for each chromosome. As shown in Supplementary Figure 1, regions with low SNP density correspond to regions predicted to be nearly identical by descent in LG and SM21. b MAF distributions are shown for 4.3 million imputed SNPs (gold; unfiltered) and for the 523,028 SNPs used for GWAS (orange; filtered). Mean MAF is the same in both SNP sets. c Comparison of LD decay in G50–56 (dark purple) and G34 (light purple) of the LG × SM AIL. Each curve was plotted using the 95th percentile of r2 values for SNPs spaced up to 5 Mb apart

