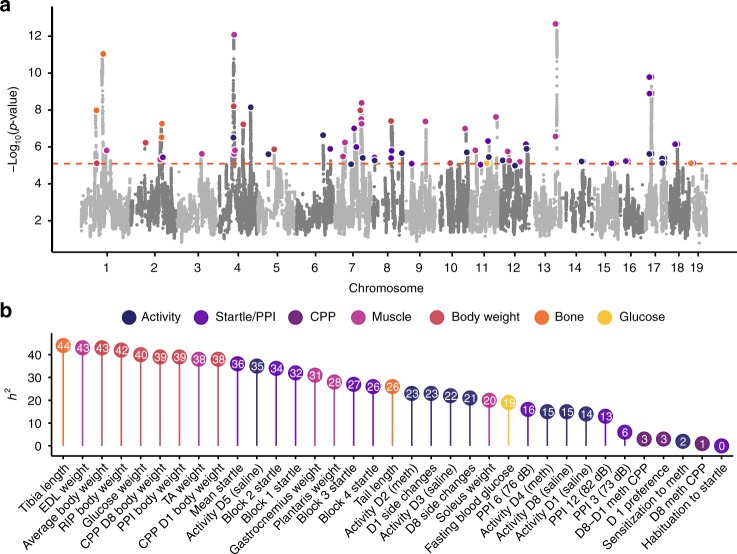
Fig. 3.
Manhattan plot and heritability for 120 traits measured in the LG × SM AIL. We identified 126 loci for behavioral and physiological traits using 1063 mice from G50–56 of the LG × SM AIL. A Manhattan plot of GWAS results is shown in (a). Associations for related traits are grouped by color. For clarity, related traits that mapped to the same locus (Supplementary Data 1) are highlighted only once. The dashed line indicates a permutation-derived significance threshold of −log10(p) = 5.09 (p = 8.06 × 10⁻⁶; α = 0.05; likelihood ratio test). b For a representative subset of traits, SNP heritability estimates (percent trait variance explained by 523,028 GWAS SNPs) are shown. Precise estimates of heritability with standard error are provided for all traits in Supplementary Data 2

