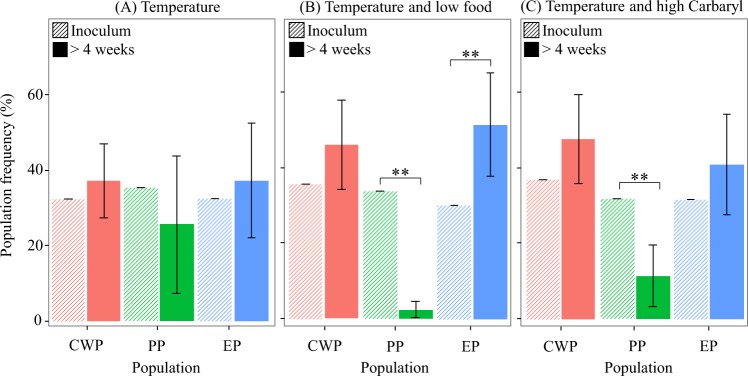
Figure 3.
Competition experiments. Population frequencies with variance are shown after four weeks of exposure (‘>4 weeks’) to (A) temperature, (B) temperature and limiting food levels, and (C) temperature and high Carbaryl as compared to an equal starting inoculum of the three populations (‘inoculum’). The starting inoculum had no variance as all mesocosms were inoculated with equal number of genotypes. Population codes are as in Fig. 2. Data for the temperature experiment are from33.

