Fig. 4.
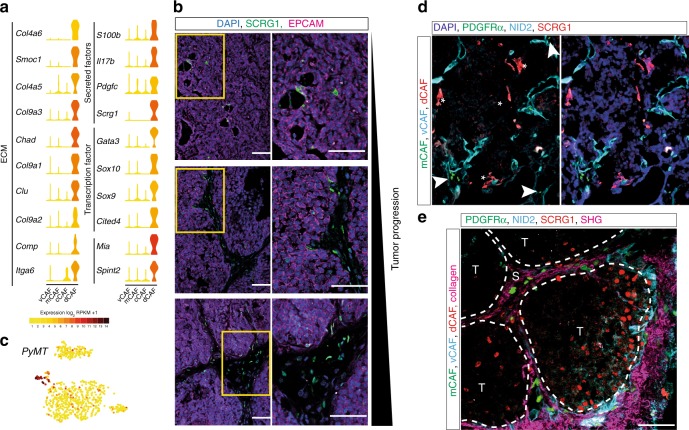
dCAF express the oncogenic driver gene and share gene expression with the tumor epithelium. a Violin plots of selected dCAF differentially expressed genes in log2(RPKM + 1). Violin colors represent mean expression of each population. Genes were sorted based on gene ontology terms. b IF staining of SCRG1 (green) and EPCAM (magenta) on MMTV-PyMT tumor sections (5 µm) from mice of age 8 weeks, 12 weeks, and 15 weeks (left to right). Nuclei were counter stained with DAPI (blue). Yellow boxes indicate the area magnified in the lower panel. c Expression plots based on t-SNE clustering. log2(RPKM + 1) levels of the virus-derived oncogenic driver gene in individual cells. d IF staining of Nidogen-2 (cyan) and SCRG1 (red) on MMTV-PyMT tumor tissue derived from PFGFRα-EGFP (green) reporter mice. Nuclei are stained with DAPI (blue). White arrowheads and stars indicate mCAF and dCAF, respectively. e IF staining of Nidogen-2 (cyan) and SCRG1 (red) on MMTV-PyMT tumor tissue derived from PFGFRα-EGFP (green) reporter mice. The image was acquired by 2-photon microscopy. Collagen fibers were detected by second harmonic generation (SHG, magenta). Dotted lines separate malignant tissue (T) from stroma (S). Scale bar: 50 µm

