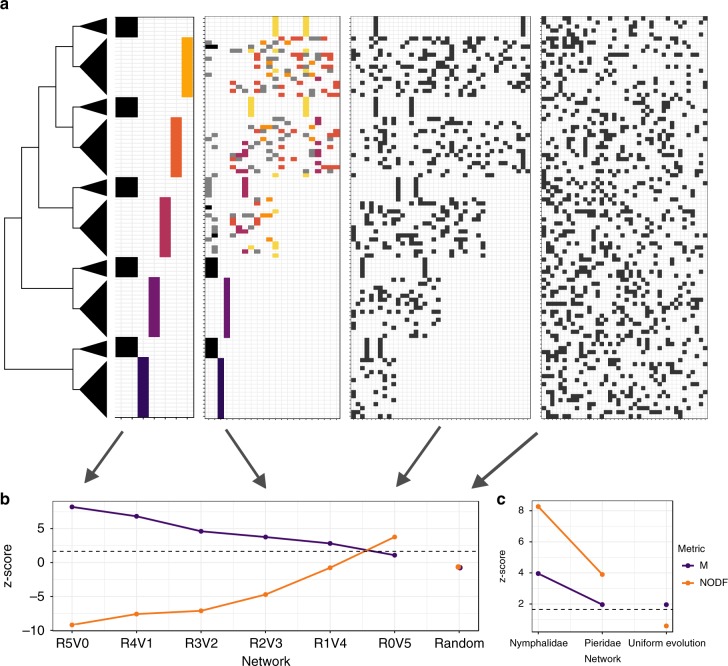
Fig. 1.
Structure of networks across simulated scenarios. a Phylogenetic tree of hypothetical butterfly group where triangle size is proportional to clade diversity. Four of the simulated networks, where each coloured cell represents an interaction between a butterfly taxon (rows—ordered to match the phylogeny) and a host taxon (columns). Interactions are coloured by module when network is significantly modular. b Z-score for nestedness (NODF) and modularity (M) for each simulated network, calculated by comparing each estimate to null model expectations (see Methods for more details). The horizontal dashed line indicates the significance threshold for values higher than expected under the null model. Simulation R5V0 represents the pure radiation scenario (i.e., five radiations) and R0V5 represents the pure variability scenario, with intermediate levels of both in between them. “Random” is the network where interactions were assigned randomly. c Z-score for empirical networks and simulated network produced by the uniform evolution scenario

