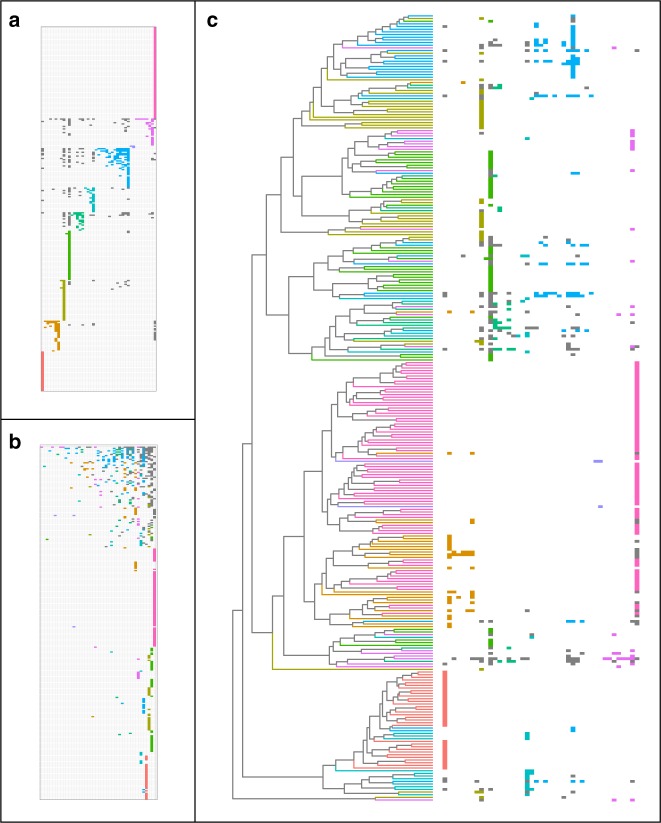
Fig. 2.
Three different ways of viewing the Nymphalidae-plant network. Butterfly genera are in rows and host plant orders are in columns. Each filled cell indicates a butterfly–plant interaction and each colour shows interactions within a module (grey cells are interactions between modules). a Rows and columns sorted to emphasise modular affinity (order of modules is arbitrary). b Rows and columns sorted to emphasise nestedness, ordered from the upper right corner according to descending number of interactions. c Resorting of the rows of the matrix (right) to match the Nymphalidae phylogeny (left) and highlight the phylogenetic diversity in each module. Branches of the phylogeny are coloured by module affiliation of the terminal taxa. Note that module colours are consistent with Fig. 3. For taxon names see Supplementary Figs. 5 and 6

