Fig. 3.
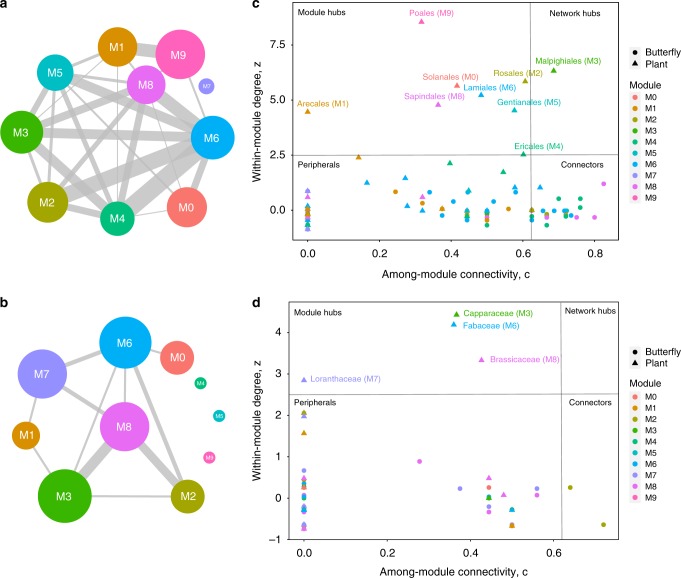
Overview of the modular structure and detailed contributions of taxa in the networks. a, b Graph of module interactions for the nymphalid and pierid networks, respectively. Circle size reflects the number of butterflies and plants within each module, and the width of the links (grey lines) between them reflects the number of interactions between modules. c, d Relative contribution of each taxon to the modular structure, defined by measures of connectivity with taxa within the same module (y axis) and with taxa assigned to other modules (x-axis) of the nymphalid and pierid networks. Names of modules and network hubs are shown. Colours of modules are consistent with Figs. 2 and 4

