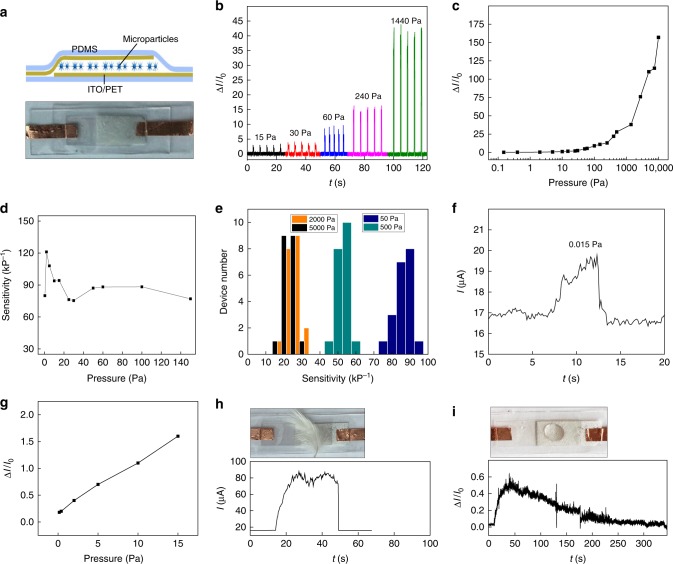
Fig. 2.
Pressure-sensing characterizations. a Schematic of the layered structure in the sensor (top panel) and photo of an actual fabricated device (bottom panel). b Current response (ΔI/I0) from a device applied with different pressures. The current was measured at a constant voltage bias of 5 V. c Current response from the device in the pressure range of 0.1–104 Pa. d Device sensitivity, defined as the slope at the corresponding pressure, in the range of 0.1–150 Pa. e Statistical distribution of sensitivity at different pressures from 20 devices, with average sensitivity of 86.5 ± 4, 52.9 ± 3.7, 28 ± 3.4, and 23.4 ± 4.3 kPa−1 at pressures of 50, 500, 2000, and 5000 Pa, respectively. f Current response in a device at an applied static pressure of 0.015 Pa, and g its current response at the low-pressure range of 0.1–15 Pa, showing approximately linear relationship with an average slope ~94 kPa−1. h Current response in a device responding to a landed feather on top (top). i Current response in a device registering the dynamic evaporation process of a droplet of ethanol (~40 µL) on top of the device (top)

