Fig. 3.

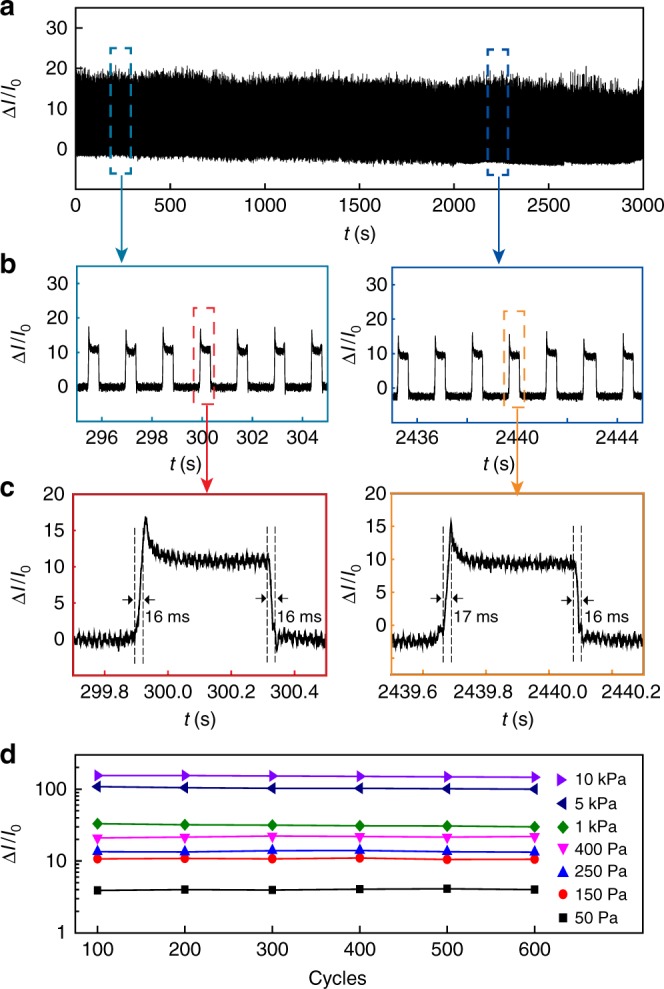
Mechanical cyclability. a Current response from a device during a continuous, repetitive (e.g., >2000 cycles) pressure loading (150 Pa, T = 1.5 s, duty cycle 34%). b Zoom-in signals at the beginning (left panel) and final (right panel) stages of the cycling test, showing that the signal amplitude ~11 was well maintained. c Zoom-in signals in one cycle at the beginning (left panel) and final (right panel) stages of the cycling test, showing that a response time ~16 ms was maintained. d Signal amplitudes at different applied pressures during cycling tests
