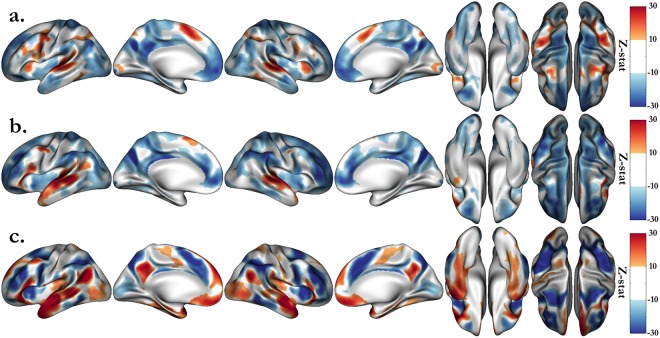
Figure 1.
Group average activations for the HCP language tasks, including MATH (a) and STORY (b) blocks, and the STORY-MATH contrast (c). Group maps are shown with a lower threshold of z = ±10 and saturation from z = 30 to introduce the main areas activated by the tasks. Due to the large number of subjects, the associated p-values are significant; we arbitrarily set the thresholds to emphasize the regions that are known to be recruited by these tasks.

