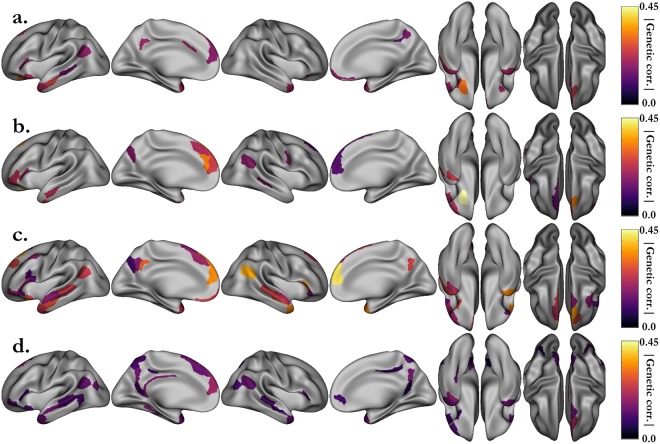
Figure 5.
Shared genetic variance (absolute value) between the grayordinate activations of the STORY-MATH contrast and the NIH behavioral scores. (a) Fluid intelligence (PMAT24_A_CR). (b) Working memory (ListSort). (c) Vocabulary comprehension (PicVocab). (c) Reading decoding (ReadEng). Associated p-values (p < 0.05, uncorrected) can be found in Fig. S4. Genetic correlation was investigated only for areals that were significantly phenotypically correlated (Fig. 4).

