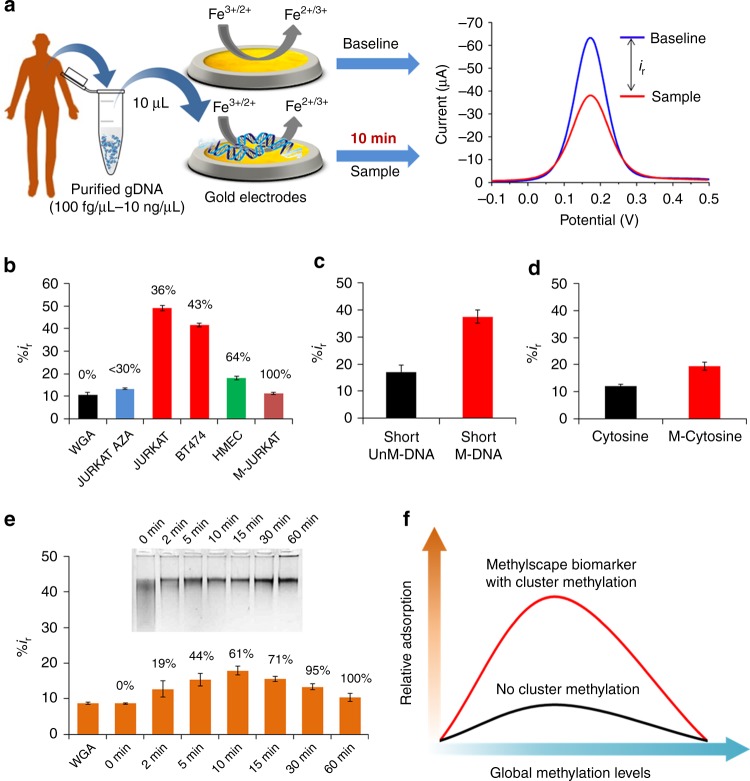
Fig. 2.
Role of methylation on DNA-gold affinity. a Methodological approach for the electrochemical quantification of DNA adsorption on gold electrodes. First, the DPV current from the bare gold electrode was measured to get the baseline signal. The purified DNA extracted from cell line, tissue or plasma samples were then adsorbed onto the gold electrodes and the DPV current was measured to get the sample signal. The difference between the baseline and the sample signal is the ir value, which is normalized to %ir for better understanding. The %ir for a given DNA sample directly correlates with the adsorption level of DNA on gold electrodes. b Relative current (%ir) mean values for the unmethylated WGA DNA (black), Aza treated demethylated Jurkat DNA (Blue), gDNA from BT474 and Jurkat cancer cells (red), HMEC gDNA from primary mammary cells (green) and 100% methylated gDNA from Jurkat cells (Brown). c Bar graph of relative current (%ir) mean values for the adsorption of 140 bp methylated (red) and unmethylated (black) DNA fragments. d Bar graph of relative current (%ir) mean values for the adsorption of individual cytosines (black) and methylcytosines (red) nucleotides. e Relative current (%ir) mean values for various genomic DNAs prepared from WGA DNA by enzymatic reaction at different time points. Sample methylation levels are provided above each bar. Inset: electrophoresis gel of the enzymatically methylated DNA samples digested with methylation sensitive HpaII restriction enzyme. f Effect of cluster methylation towards adsorption. Each data point for b–e represents the average of three separate trials, and error bars represent the standard deviation of measurements (%RSD = < 5% for n = 3)

