Figure 5.
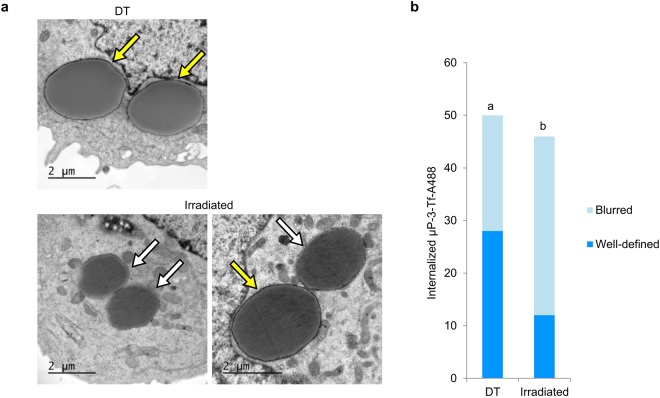
TEM evaluation of membranes surrounding internalized µP-3-Tf-A488. (a) Internalized µP-3-Tf-A488 in non-irradiated cells (DT) or in irradiated cells incubated with 2 µg/ml AlPc with well-defined (yellow arrows) or blurred (white arrows) surrounding membranes. (b) Number of internalized µP-3-Tf-A488 in control (DT) or irradiated cells surrounded by either well-defined or blurred membranes. Different letters on top of the columns denote significant differences between the distributions of the two types of membranes.

