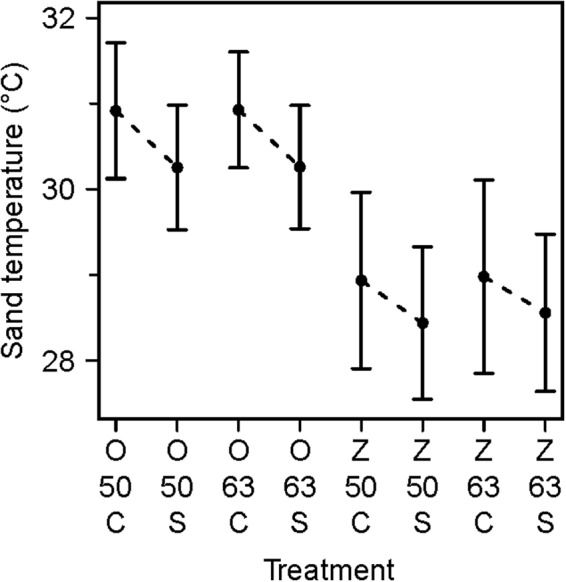
Figure 3.

Beach and treatment had an effect on sand temperature. Mean sand temperatures are given for each group of loggers in a treatment plot (i.e. shaded) and associated control plot. The intervals define the standard deviation. O: Oranjebaai Beach; Z: Zeelandia Beach; 50: 50 cm; 63: 63 cm depths; C: Control; S: Shaded. The dashed lines highlight the difference between a control plot and the corresponding shaded plot situated on the same beach and at the same depth.
