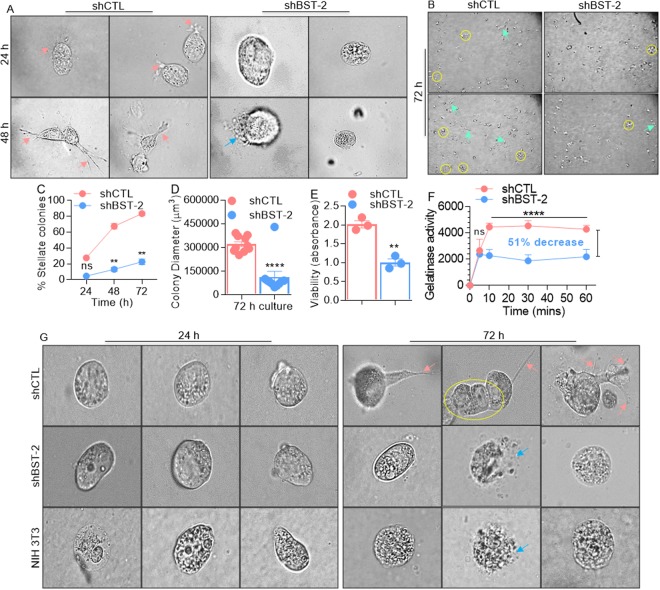
Figure 4.
BST-2 expressing breast cancer cells form invasive (stellate) structures: (A) High powered microscopic images (60x) showing morphological changes and cell invasion when 4T1 cells invade 3D matrix. Following matrix embedment, shCTL but not shBST-2 cells in matrix start forming serrated invasive (stellate) protrusions by 24 h, and completely invade into the matrix by 48 h. Pink arrows show invasive structures while blue arrow shows ruptured membrane. Images were taken at stated magnification from five different fields. Olympus ix80 inverted microscope with integrated high precision focus drive was used to obtain images. (B) Low magnification images (4x) of 72 h matrix embedded shCTL and shBST-2 cells for quantitative evaluation of invasive structure characteristics. Cyan arrows point to invasive structures and yellow circles depict colonies. (C) Quantitation of the number of stellate colonies formed over time expressed as a percentage of total number of colonies per dish (invasive and non-invasive). (D) Quantification of colony size by measuring the diameter of 10 colonies/field. (E) Viability of matrix-embedded shCTL and shBST-2 cells. (F) Gelatinolytic activity of shCTL and shBST-2 cells. Increase in fluorescence (per time unit) between the shCTL and shBST-2 indicate enhanced catalysis. The percentage inhibition was calculated at t = 60 minutes. (G) High powered microscopic images (20x immersion with 6x mechanical zoom) showing cells at 0 h immediately after plating in 3D matrix and after 72 h. Pink arrows show invasive structures, blue arrow shows ruptured membrane, and yellow circle depict cell cluster. For panels C–F, error bars represent standard deviations and significance was taken at P < 0.05*, **0.01, ****0.001. n.s = not significant.

