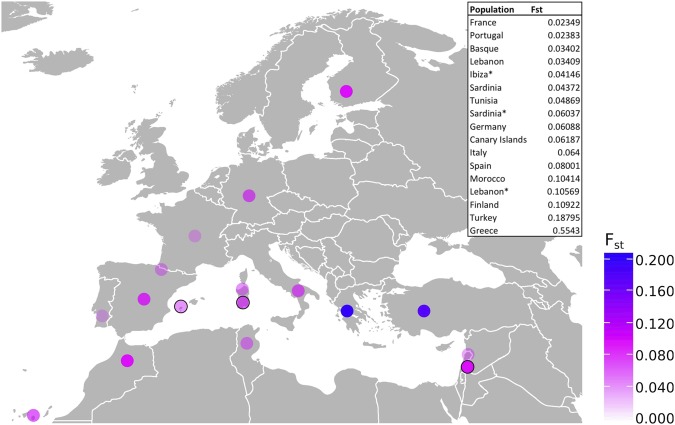
Figure 4.
FST geographical mapping based on complete mitogenomes. Results of genetic distance (pairwise FST) values between modern Ibizans and other modern Mediterranean, European and ancient Phoenician populations3,34,41–47. Dark blue values represent higher FST values (greater distance) and light pink represents lower FST values compared to modern Ibizans. Ancient Phoenician populations are identified by the black outline of the circles. Exact FST values are listed in the inset table. Ancient Phoenician populations are indicated in the table by asterisks.

