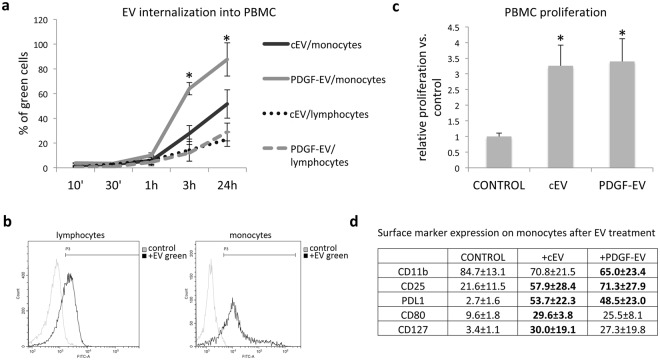
Figure 2.
EV interaction with PBMC. (a) The diagram of EV internalization in monocyte and lymphocyte PBMC fractions during 24 hours. Total PBMC fractions isolated from healthy donors were stimulated with EVs labeled with PKH67GL green fluorescent cell linker. After the indicated time periods cells were analyzed by FACS, and the statistics was performed on monocyte and lymphocyte gates separately (mean ± SEM, *p < 0.05 vs. cEVs, n = 5); (b) the representative images of FACS analysis of PBMC incubated with PKH67GL labeled EVs during 24 hours. The left diagram shows the lymphocyte fraction; the right diagram shows the monocyte fraction. (c) The diagram of PBMC proliferation rate after stimulation with EVs, analyzed by BrdU ELISA (mean ± SEM, *p < 0.01 vs. control PBMC, n = 3); (d) the surface marker expression on monocytes after EV treatment (mean % ± SEM, in bold - p < 0.05 vs. control PBMC, n = 4).

