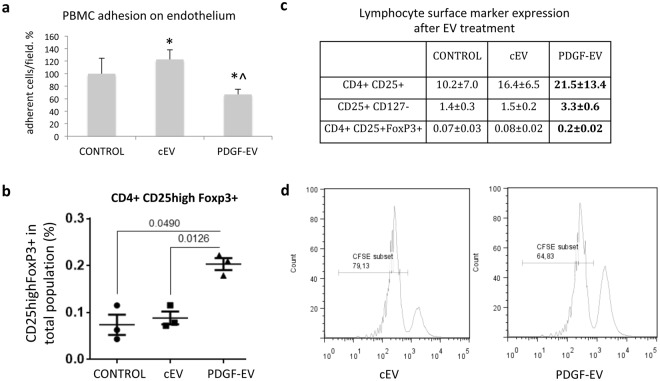
Figure 4.
EV influence on PBMC. (a) PBMC adhesion on endothelium. PBMC and HUVEC were separately pre-stimulated with EVs 24 hours before, and then PBMC were labeled with PKH26GL red fluorescent cell linker and were added to HUVEC for 1 hour. After washing, adherent cells were counted by digital analysis (results mean ± SEM, *p < 0.05 vs. control PBMC, ^p < 0.05 vs. cEVs, n = 8). (b) The lymphocyte surface marker expression after EV treatment (mean % of total lymphocyte population ± SEM, in bold - p < 0.05 vs. control PBMC, n = 5). (c) The diagram of CD25high +/FoxP3 + expression on CD4 + cells (p-value between groups is indicated, n = 3). (d) The representative FACS image of CFSE labeled T cells after 5-day culture with Treg, isolated from PBMC stimulated by cEVs or PDGF-EVs, the percentage of proliferated cells is indicated.

