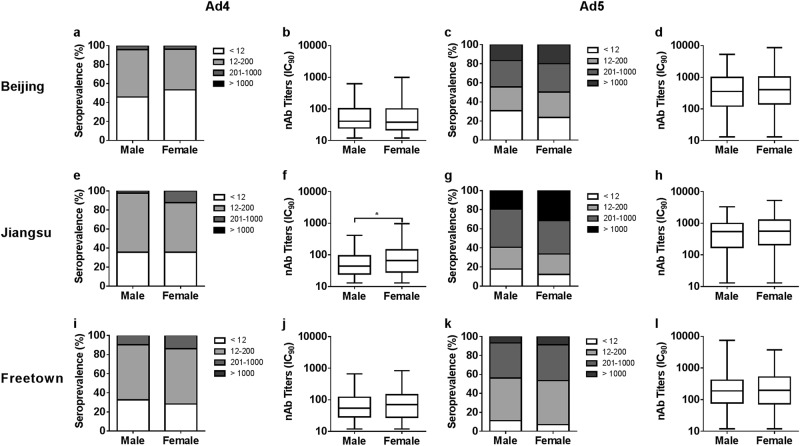
Fig. 3. Distributions of HAdV-4 and HAdV-5 nAbs between gender groups in different regions of China and Sierra Leone.
The distributions of HAdV-4 and HAdV-5 nAbs between males and females in Beijing (a, c), Jiangsu (e, g) and Freetown (i, k) are shown. The comparisons of adenovirus seropositive rates between gender groups were analyzed by Pearson chi-square tests. The HAdV-4 and HAdV-5 nAb titers between males and females with detectable nAbs from Beijing (b, d), Jiangsu (f, h), and Freetown (j, l) are shown. The data were analyzed by Mann–Whitney tests. In all the above comparison tests, a P value of <0.05 was considered significant

