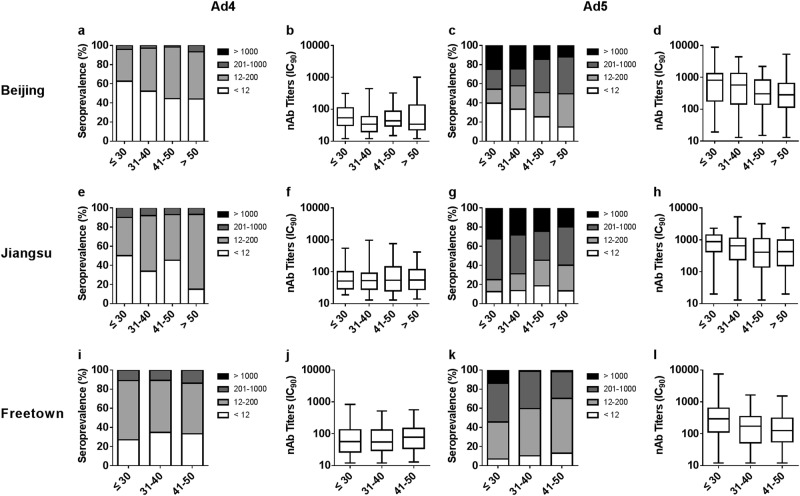
Fig. 4. Distributions of HAdV-4 and HAdV-5 nAbs in different age groups and regions of China and Sierra Leone.
The distribution of HAdV-4 and HAdV-5 nAbs in age groups in Beijing (a, c), Jiangsu (e, g), and Freetown (i, k) are shown. The trends in adenovirus seropositive rate versus age were analyzed by Cochran–Armitage trend tests. The titers of HAdV-4 and HAdV-5 nAbs in seropositive donor age groups in Beijing (b, d), Jiangsu (f, h), and Freetown (j, l) are shown. The data were analyzed by Jonckheere–Terpstra tests

