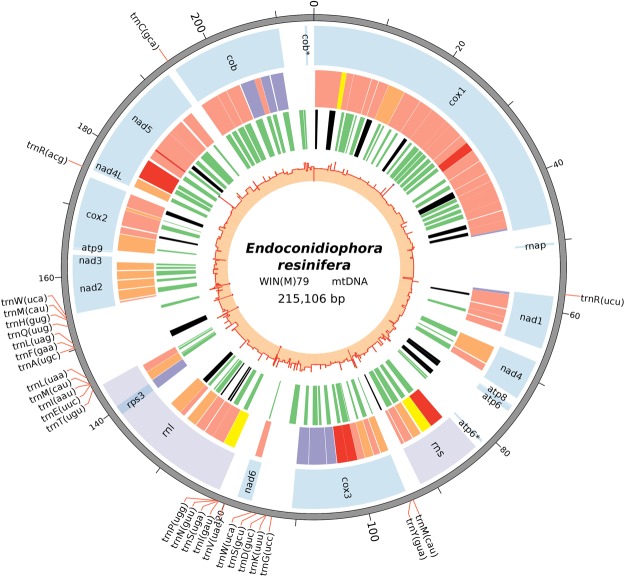
Figure 1.
The annotated mitochondrial genome of E. resinifera [strain WIN(M)79]. The total size of this circular genome is 215 kb (represented by the scale). The position of the tRNAs are shown on the outer track, with the positions connecting to the scale with red lines. The first inner circle represents the position, size and the names of the protein-coding and rRNA genes. The introns are shown in the second inner circle and are colour coded according to the intron types/subtypes: group II (yellow), group IA (purple), group IB and group I derived (very light red), group IC (orange), and group ID (dark red). The third inner circle is to visualize the presence of the LAGLIDADG (green) or GIY-YIG (black) homing endonuclease genes encoded by the introns. The innermost circle is the GC plot of this genome; calculating GC% of genome features. Note the third inner circle also shows the location of free-standing homing endonuclease genes.

