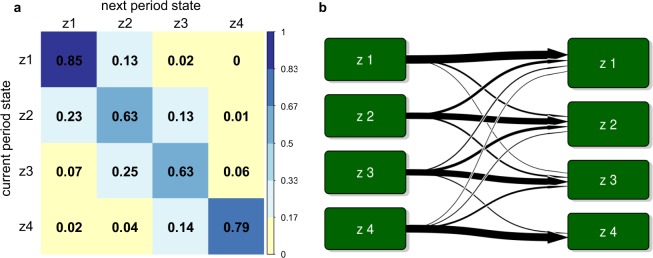
Figure 2.
State transition for the Poisson hidden Markov models from the time series indexed each 15 min. (a) Transition probability matrix. Values in each cell represent average probability computed on the total sample of patients. Diagonal of the matrix represents the probabilities of not changing in the next period. Cells with zero probability represent a value < 0.005. (b) State transition diagram. Arrows indicate the probability of transition from each state to other ones: thicker arrows indicate higher probability; no arrow indicates the probability is zero (or near zero).

