Fig. 5.
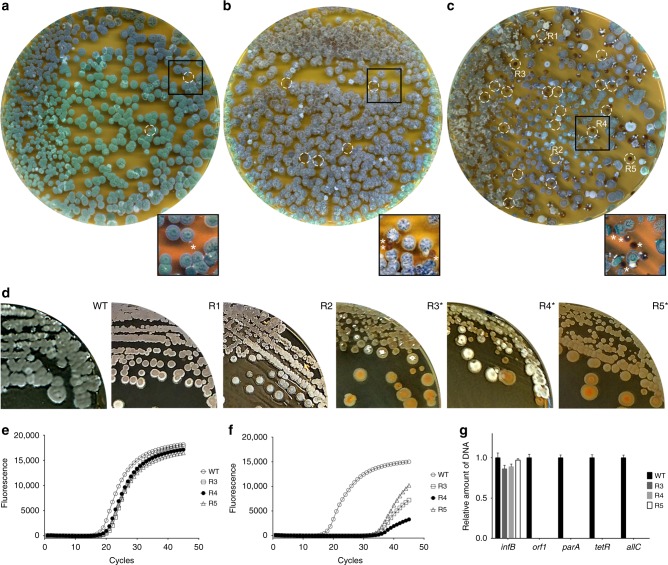
S-cell formation and switching leads to loss of the linear megaplasmid KVP1. Morphology of 7-day-old colonies of K. viridifaciens on MYM medium obtained after plating spores (a), protoplasts (b) or S-cells (c). The switch of S-cells to the mycelial mode-of-growth yields colonies with different morphologies: besides grey-pigmented colonies (R1, R2), colonies are formed that fail to develop efficiently, and which appear whitish or brown (R3-R5). Brown colonies are also evident when protoplasts are plated (b, white circles), but rare when spores are used. d Subculturing of R1 and R2 leads to the formation of grey colonies that appear similar to the wild type, while subculturing of R3, R4 and R5 yield colonies that are unable to form a robust sporulating aerial mycelium (brown and white colonies). Quantitative real-time PCR of the infB (e) and allC (f) genes using gDNA of the wild type and R3-R5 as the template. In all strains, the infB gene located on the chromosome is amplified before the 20th cycle. However, the allC gene, located on the KVP1 megaplasmid, is amplified in the wild type before the 20th cycle, but in strains R3-R5 after the 30th cycle. Values represent the average of two replicates. g Quantitative comparison of the relative abundance of four megaplasmid genes (orf1, parA, tetR and allC) and the infB gene (located on the chromosome) between the wild type and strains R3-R5. The strong reduction in the abundance of the megaplasmid genes are consistent with loss of this plasmid. qPCR data were normalized to the housekeeping gene atpD. Error bars indicate the SEM

