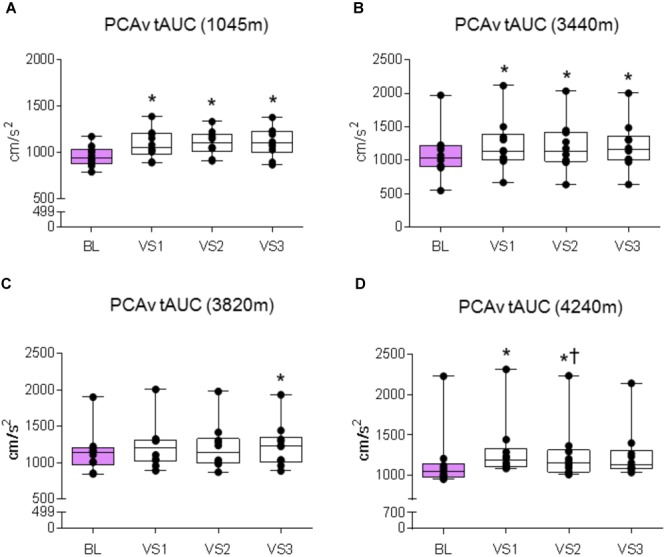
FIGURE 7.

PCAv tAUC response. Comparison of the posterior cerebral artery velocity total area under the curve (PCAv tAUC) achieved during BL and PCAv tAUC during each individual VS. Significant differences were found between BL PCAv tAUC and PCAv tAUC during VS at (A) 1045 m (P < 0.006), (B) 3440 m (P < 0.003), (C) 3820 m (P = 0.005), and (D) 4240 m (P < 0.005). ∗ = Statistical significance from BL. † = Statistical significance from VS 1. Presented as scatter plots representing individual participants with box and whiskers showing median, 25–75 percentile with minimum and maximum values.
