FIGURE 2.

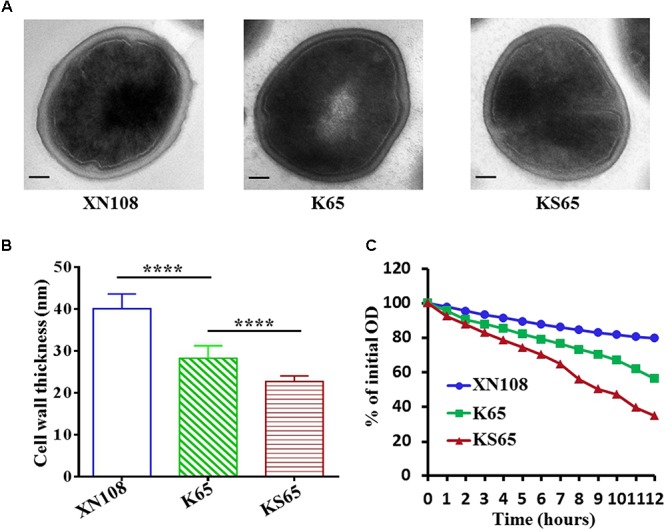
Transmission electron microscopy and autolytic analysis of the XN108 and its derivates. (A) Morphological features of VISA XN108 and its derivates K65 and KS65 observed under a transmission electron microscope (magnification, × 120,000; bar = 100 nm). (B) Comparison of cell wall thickness of XN108, K65 and KS65. Data are expressed as the mean ± SD for 60 cells of each strain. Differences were evaluated by Student’s t-test, and all statistical tests were two-tailed. ∗∗∗∗P < 0.0001. (C) Triton X-100 stimulated autolytic analysis. Bacterial cells were grown in BHI broth to mid-logarithmic phase, pelleted, washed twice with ice-cold water, and then analyzed as described in Methods. The percentage of the remaining optical density of each strain at each time point was plotted. The test was repeated 3 times, and 1 representative was indicated.
