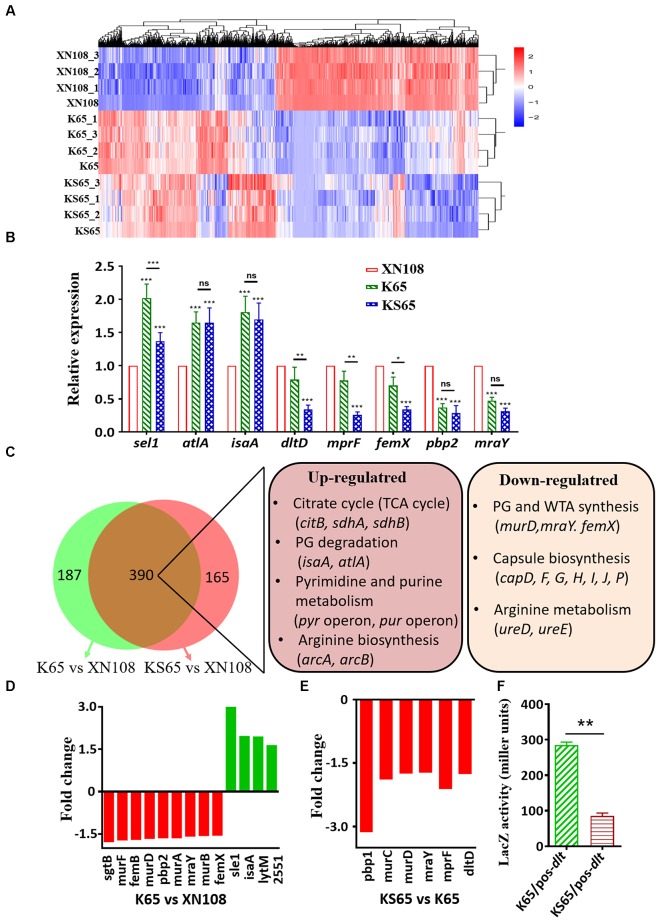
FIGURE 3.
Transcriptional profiles of XN108, K65, and KS65. (A) Pairwise Euclidean distance with respect to the transcriptional profiles from each biological repeated sample. (B) RT-qPCR detection of the expression levels of indicated genes in XN108, K65, and KS65. Data from one experiment with three biological replicates were presented as mean ± SD. Expression of each gene of interest in XN108 was normalized to the 16S RNA gene expression and adjusted to 1.0, and their relative expressions in K65 and KS65 strains were indicated. ∗P < 0.05, ∗∗P < 0.01, and ∗∗∗P < 0.001, and ns represents no significance. (C) Schematic representation of the expression altered genes in K65 vs. XN108 (green) and KS65 vs. XN108 (pink). A total of 390 genes were commonly changed, and the major upregulated and downregulated genes are involved in certain biological pathways in KEGG analysis. (D)The fold change of the upregulated (red) and downregulated (green) genes responsible for cell wall biosynthesis and bacterial autolysis in K65 vs. XN108. (E) The fold change of the downregulated genes responsible for cell wall biosynthesis and modification in KS65 vs. XN108. (F) β-galactosidase assay. The pOS-dlt reporter plasmid was transformed into K65 and KS65, respectively. The LacZ activity was detected and represented as mean ± SD (n = 3). ∗∗P < 0.01.

