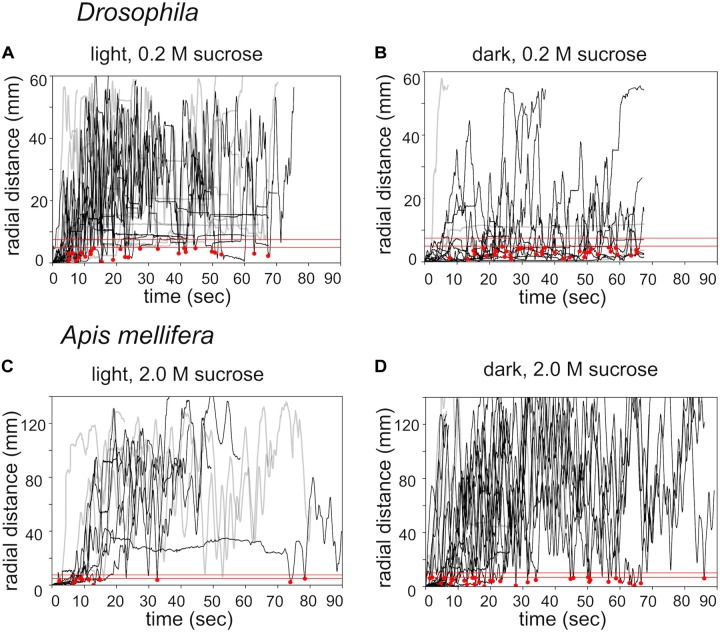
FIGURE 3.
Effects of lighting conditions on search behavior. Time plots of radial distances for search trajectories induced by different food rewards and different lighting conditions. (A) Drosophila: light condition / 0.2 M sugar-fed n = 14. (B) Drosophila: dark condition / 0.2 M sugar-fed n = 12. (C) Apis mellifera: light condition / 2.0 M sugar-fed n = 9. (D) A. mellifera: dark condition / 2.0 M sugar-fed n = 10. Black lines: walking trajectories with returns to location of the sugar drop; gray lines: no returns. Red lines: threshold distances to identify a return to the sugar drop location (see experimental procedures). The upper red line (r1): Drosophila r1 = 4 mm, A. mellifera r1 = 12 mm); lower red line (r0): Drosophila r0 = 2.5 mm, A. mellifera r0 = 7 mm); red dots: returns to the location of the sugar drop.

