FIGURE 4.
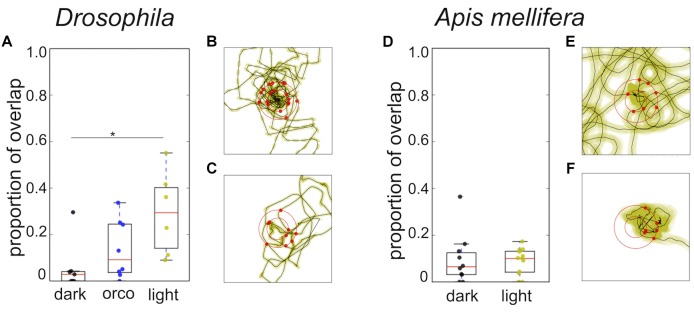
Overlap of trajectories and distribution of return angles. (A) Drosophila: Comparison of overlap in the trajectories wild-type flies tested in light or dark condition and trajectories of orco mutant flies tested under light condition. Search trajectories showed a significantly higher degree of overlap in light compared to the dark condition (light; n = 6; dark; n = 7; Mann–Whitney U-test p = 0.02; Dunn post hoc test dmin 3: p = 0.022; dmin 5: p = 0.035). Orco mutants tested under light conditions showed the tendency to have a higher degree of overlap than wild type flies tested in the dark and a lower degree of overlap than flies tested in light. Yellow: light condition; black: dark condition; blue: Drosophila Orco mutant. ∗p < 0.05. (B) Drosophila: Example of return directions in one search trajectory in the dark (n = 9). (C) Drosophila: Example of return directions in one search trajectory in light (n = 9). Radius of the outer circle: 9 mm. We did not find any statistically significant evidence for a bias in the return directions. (D) A. mellifera: Search trajectories of honey bees showed a low degree of overlap and did not differ under different light conditions. Yellow: light condition; black: dark condition. (E) A. mellifera: Example of return directions in one search trajectory in the dark (n = 10). (F) A. mellifera: Example of return directions in one search trajectory in light (n = 11). Radius of the outer circle: 14 mm. We did not find any statistically significant evidence for a bias in return directions.

