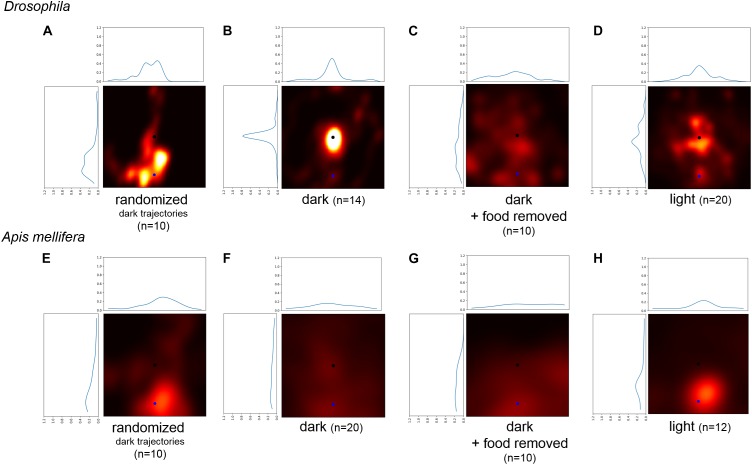
FIGURE 5.
Comparison of the probability to return to a randomly selected point of the trajectory and the location of the sugar-drop for Drosophila. (A) Probability heatmap of artificial trajectories generated by taking step size and turning angles from real trajectories performed by flies under dark condition and then randomly shuffling the temporal order (n = 10). (B) Probability heatmap of the spatial distribution of Drosophila flies after defining a new virtual starting point at a radial distance of 22 mm using walking trajectories under dark condition (n = 14). (C) Probability heatmap of the spatial distribution of Drosophila flies after defining a new virtual starting point at a radial distance of 22 mm using walking trajectories of the disk experiments under dark condition (n = 10). (D) Probability heatmap of the spatial distribution of Drosophila flies after defining a new virtual starting point at a radial distance of 22 mm using walking trajectories under light condition (n = 20). (E) Probability heatmap of artificial trajectories generated by taking step size and turning angles from real trajectories performed by honey bees under dark condition and then randomly shuffling the temporal order (n = 10). (F) Probability heatmap of the spatial distribution of honey bees after defining a new virtual starting point at a radial distance of 45 mm using walking trajectories under dark condition (n = 20). (G) Probability heatmap of the spatial distribution of honey bees after defining a new virtual starting point at a radial distance of 45 mm using walking trajectories of the disk experiments under dark condition (n = 10). (H) Probability heatmap of the spatial distribution of honey bees after defining a new virtual starting point at a radial distance of 45 mm using walking trajectories under light condition (n = 12).

