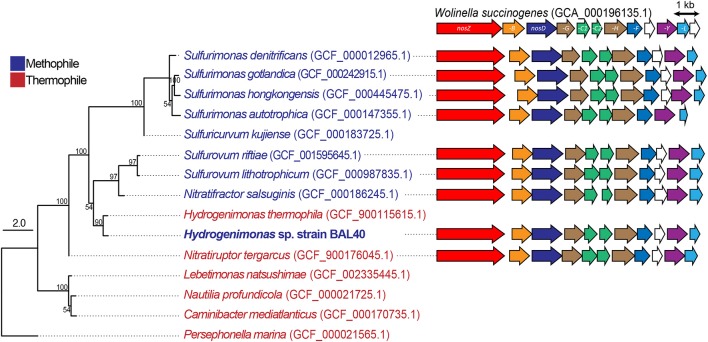
Figure 3.
ML tree based on genome sequences and schematic comparison of the nos gene clusters in different Campylobacteria. Bootstrap values based on 500 resampling replicates are shown as percentages at branch nodes. Clade II nosZ and its accessory genes (BDFGHLY) are labeled and colored according to homology across the different species.

