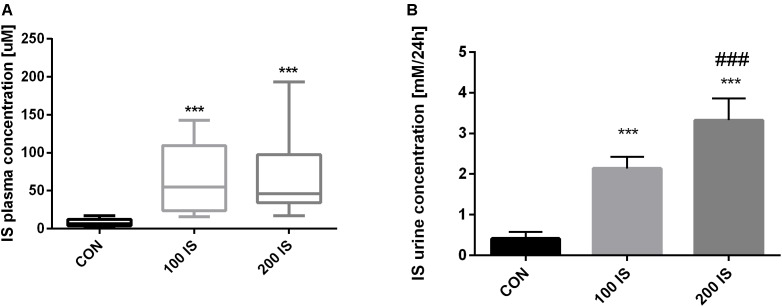
FIGURE 1.
The plasma (A) and urine (B) concentrations of IS after chronic administration. Data are presented as the mean ± SD or median (full range) depending on their distribution. CON, control group; 100 IS, group receiving IS in the dose of 100 mg/kg b.w./day; 200 IS, group receiving IS in the dose of 200 mg/kg b.w./day; IS, indoxyl sulfate; ∗∗∗p < 0.001 compared to control; ###p < 0.001 compared to 100 IS group.

