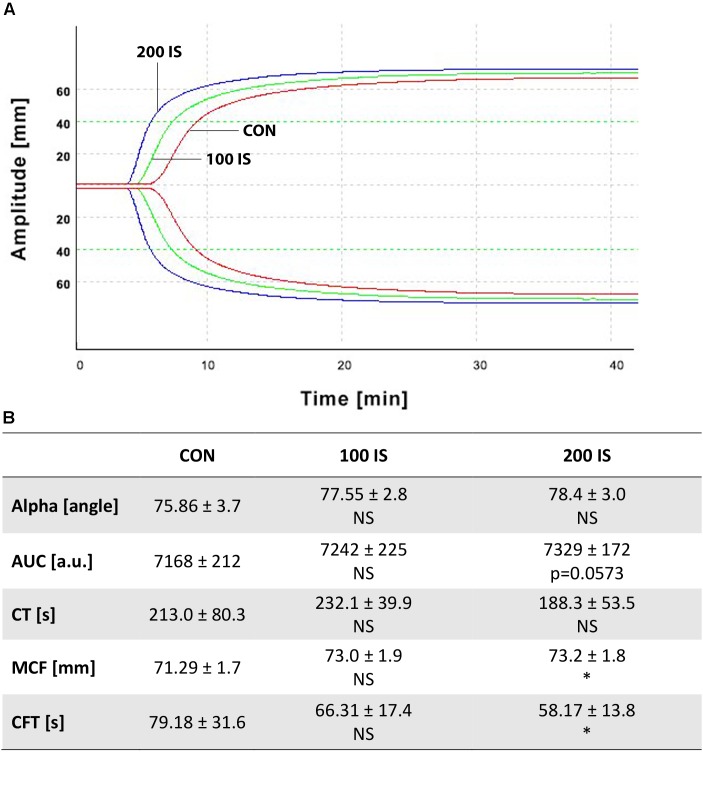
FIGURE 3.
(A) Graphical representation of influence of IS on ROTEM analyses. (B) Impact of IS on kinetics and strength of clot formation. Data from (B) are shown as the mean ± SD. CON, control group; 100 IS, group receiving IS in the dose of 100 mg/kg b.w./day; 200 IS, group receiving IS in the dose of 200 mg/kg b.w./day; a.u., arbitrary units; AUC, area under the curve; CFT, clot formation time; CT, clotting time; IS, indoxyl sulfate; MCF, maximum clot firmness; NS, non-significant; ∗p < 0.05 compared to control.

