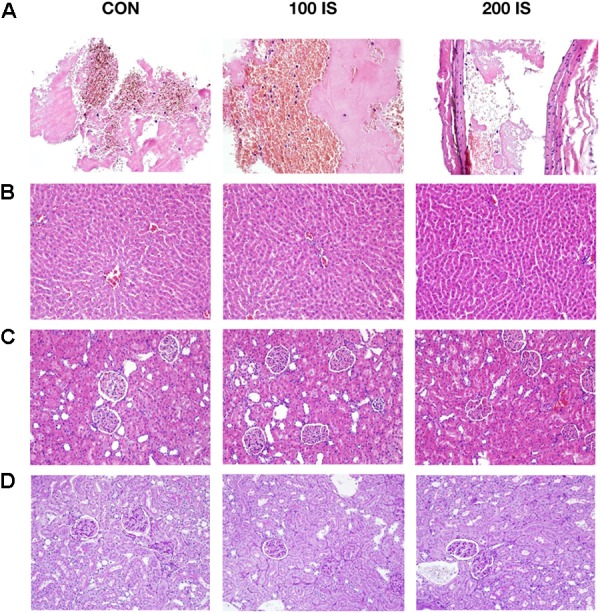
FIGURE 6.

Representative examples of the thrombi (A), livers (B), and kidneys (C,D) histology. Samples (A–C) were stained by hematoxylin and eosin (H&E). Samples (D) were stained by periodic acid schiff (PAS). Images (A) were taken using 400× magnification. Images (B–D) were taken using 200× magnification. CON, control group; 100 IS, group receiving IS in the dose of 100 mg/kg b.w./day; 200 IS, group receiving IS in the dose of 200 mg/kg b.w./day; IS, indoxyl sulfate.
