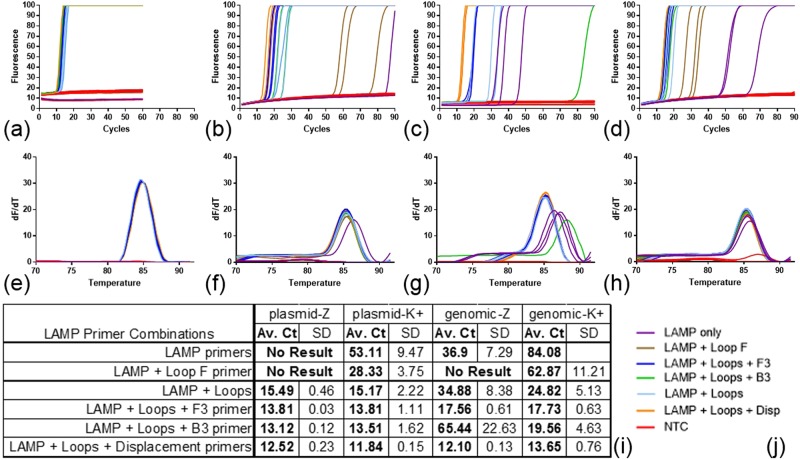
Figure 3.
LAMP amplification without displacement primers. LAMP amplification with fluorescence detection with SYTO9 dye using Z primers and K+ primers for the 35S promoter of a linearised plasmid template and a native maize genomic template (prepared from commercial Mon810 seed); fluorescence and melt curve analysis for primer combinations (j) for: (a,e) Z primers with plasmid template, (b,f) Z primers with genomic template, (c,g) K+ primers with plasmid template, (d,h) K+ primers with genomic template. The Ct values were derived from threshold setting of 0.6 and the average and standard deviation from triplicate results displayed in table (i). The DNA concentration for the linearised plasmid template was 5000 copies per partition and 2078 copies per partition for the Mon810 template. Reactions were run on a RT-PCR machine (see Methods), and since LAMP is an isothermal technique “cycle” length (panels a–d) was equivalent to one minute; hence “Av. Ct” is time in minutes to detected amplification. Primer combinations; LAMP primers only in purple, LAMP primers with Loop F in brown, LAMP with both Loops and F3 in dark blue, LAMP with both Loops and B3 in green, LAMP with both Loops in light blue, all six primers in orange, NTCs for each primer combination in red. Amplicon melt curve analysis showed positive results with a consistent melt temperature (85 degrees) for the all six primers combination. SD: standard deviation.

