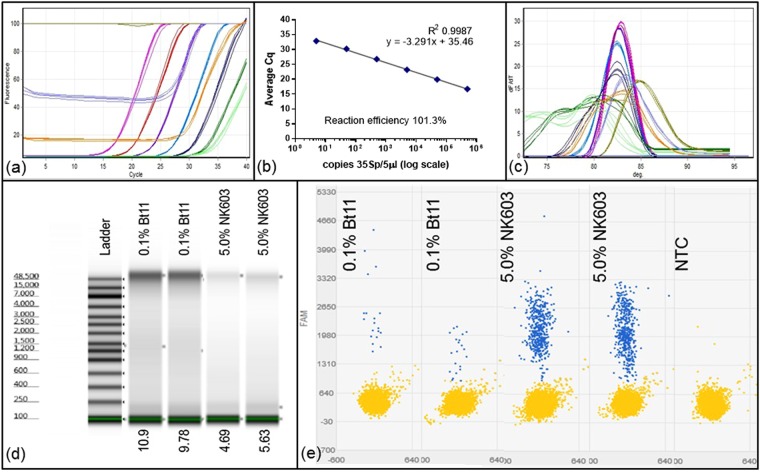
Figure 6.
Copy number determination using quantitative PCR against standard curve, Quant Studio 3D digital PCR and TapeStation analysis. (a) Quantitation of 0.1 percent Certified Reference Material (CRM) Bt11 DNA extract and known dilutions of linearised plasmid pART7[49] containing the 35Sp sequence incrementally from 500000 copies (pink) to 5 copies per 5 microlitres (dark green). Dilutions of the 0.1 percent Bt11 extract were; mid-green for undiluted, mid-blue for 1:2 dilution and light brown for 1:5 dilution. NTCs: pale green. (b) Derived standard curve using pART7 data. Standard curve of this linear plasmid DNA has calculated PCR efficiency of 101.3 percent with R2 = 0.9987. (c) Melt curve analysis of amplicons from (a). (d) TapeStation analysis of genomic DNA for undiluted 0.1 percent Bt11 and 5.0 percent NK603 CRM DNA extracts using an Agilent genomic DNA ScreenTape. (e) Quant Studio 3D digital PCR results using 35Sp primers with a TaqMan probe (see Methods) showing negative partitions in yellow and positive partitions in blue from which the concentration of the samples are calculated (Table 1).

