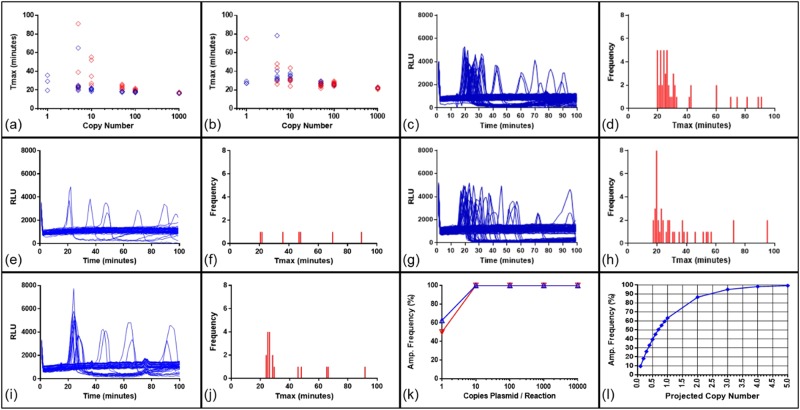
Figure 7.
Optimisation of the 35Sp K primer set. LAMP-BART time-to-peak (Tmax) results shown plotted against copy number of a linearised plasmid for; (a) comparison between K-primers in red and K+ primers in blue; (b) comparison between desalted primers in red and HPLC purified primers in blue. 8 replicates were run in each case. (c,g) Comparison between 0.5x concentration of K+ primers (0.8 micromolar LAMP, 0.4 micromolar Loop and 0.2 micromolar displacement primers) for 1 copy per partition using 96 replicates and LAMP-BART detection of linearised plasmid template with standard concentration of K+ primers described in Kiddle et al. (1.6 micromolar LAMP, 0.8 micromolar Loop and 0.4 micromolar displacement primers) (d,h) shows frequency histograms for Tmax distribution in (c,g). Comparison between native and denatured template with K+ primers: (e,f) LAMP-BART of 4 copies per partition native maize genomic DNA (Mon810), (i,j) LAMP-BART of 4 copies per partition denatured genomic template. 48 replicates were run in each case. (k) Amplification frequency for linear plasmid template using 1–104 copies; native in blue and denatured in red. (l) Predicted amplification frequency against copy number derived from UcountTM software for 0–5 copies.

